How CTV-to-app attribution works: IP matching, view-through windows and holdout tests
TL;DR
CTV-to-app attribution links a TV ad to a phone install by matching the internet protocol (IP) address the two devices share. The match is probabilistic and at household level.
A geo holdout proves whether your ads actually drove incremental sales by comparing results in regions that saw your campaign against similar regions where you intentionally did not show the ads.
Most teams need both: attribution to steer the campaign day to day, a holdout to rationalize the budget.
The scenario
A marketer was planning a six-week U.S. connected TV (CTV) test for a fitness app. The budget? $35,000 through The Trade Desk, running beside paid search and social media marketing via Meta. Success meant a paid subscription after the free trial, not an install.
Every measurement demo showed installs that followed an impression but the marketer wanted to know something else: how much of that credit belonged to people who would have signed up through branded search anyway?
The advertiser could supply subscription events and keep a few markets out of the test but it still could not identify the person on the couch (and did not want a report that pretended to).
The marketer asked a practitioner forum which platform to trust. Most of the answers said the platform matters less than understanding how the match is made. This guide starts there: how CTV-to-app attribution works, what it can prove, and how to test what it cannot.
How it works
A TV ad cannot be clicked, so the link to a phone has to be inferred. AppsFlyer, a global marketing measurement, analytics, and attribution platform, documents the flow this way.
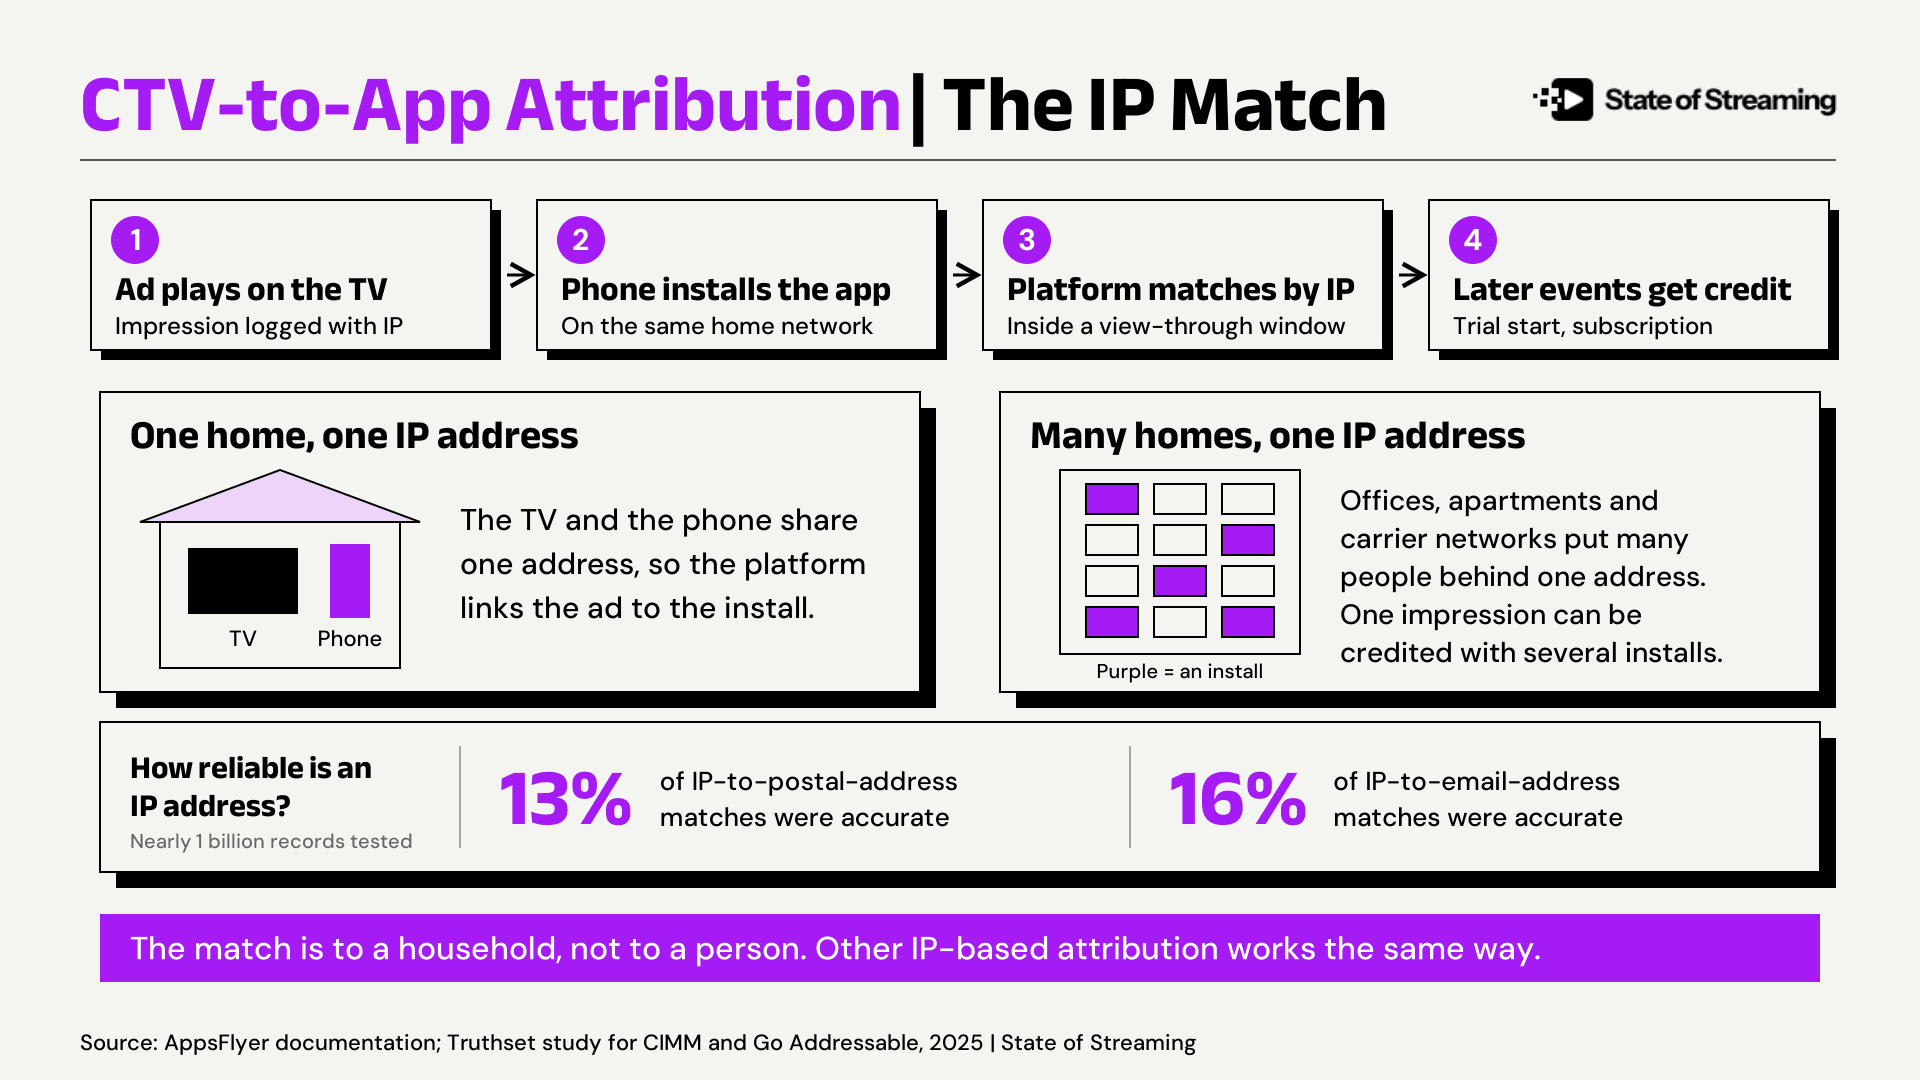
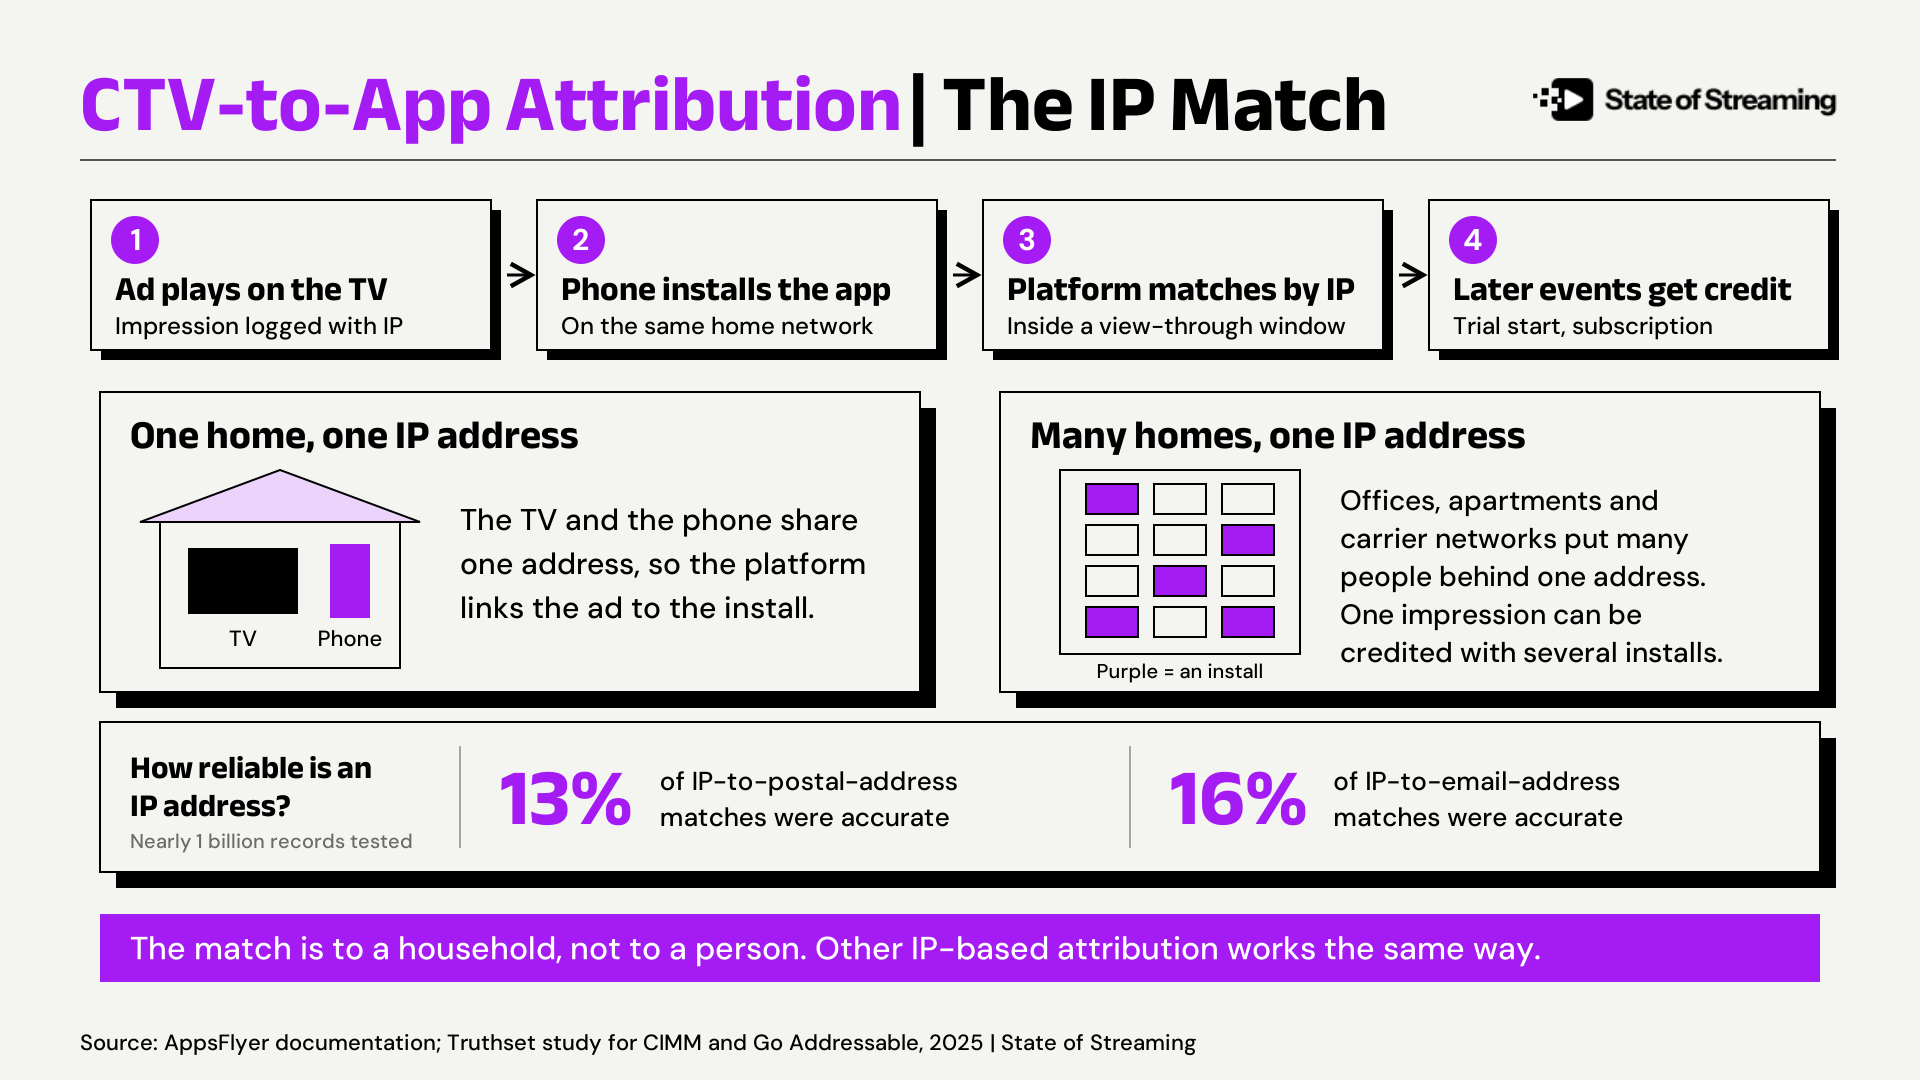
The ad plays on a TV. An impression record carrying the household's IP address goes to the measurement platform.
A phone on the same network installs and opens the app.
The platform matches the impression and the install by IP address, inside a view-through window the advertiser sets.
Later events from that install, such as a trial start or a subscription, inherit the credit.
The match has known limits. Offices, apartment buildings and mobile carriers put many people behind one IP address. One impression can be credited with several installs. Nothing in the chain identifies an individual.
IP addresses also change hands. Internet providers reassign them, so an address tied to one home last week can belong to another home today. A Truthset study commissioned by the Coalition for Innovative Media Measurement (CIMM) and Go Addressable tested nearly one billion IP records. It found IP-to-postal-address matches were accurate 13% of the time and IP-to-email matches 16% of the time. The six data providers tested also rarely matched each other. They pointed an IP address to the same postal address 6.4% of the time.
That study measured a harder task than attribution does. It tested whether an IP address can be tied to a known household for targeting. CTV-to-app attribution asks only whether two devices shared an address inside a set window. The finding still applies in one way: the longer the window, the more chance the address has moved.
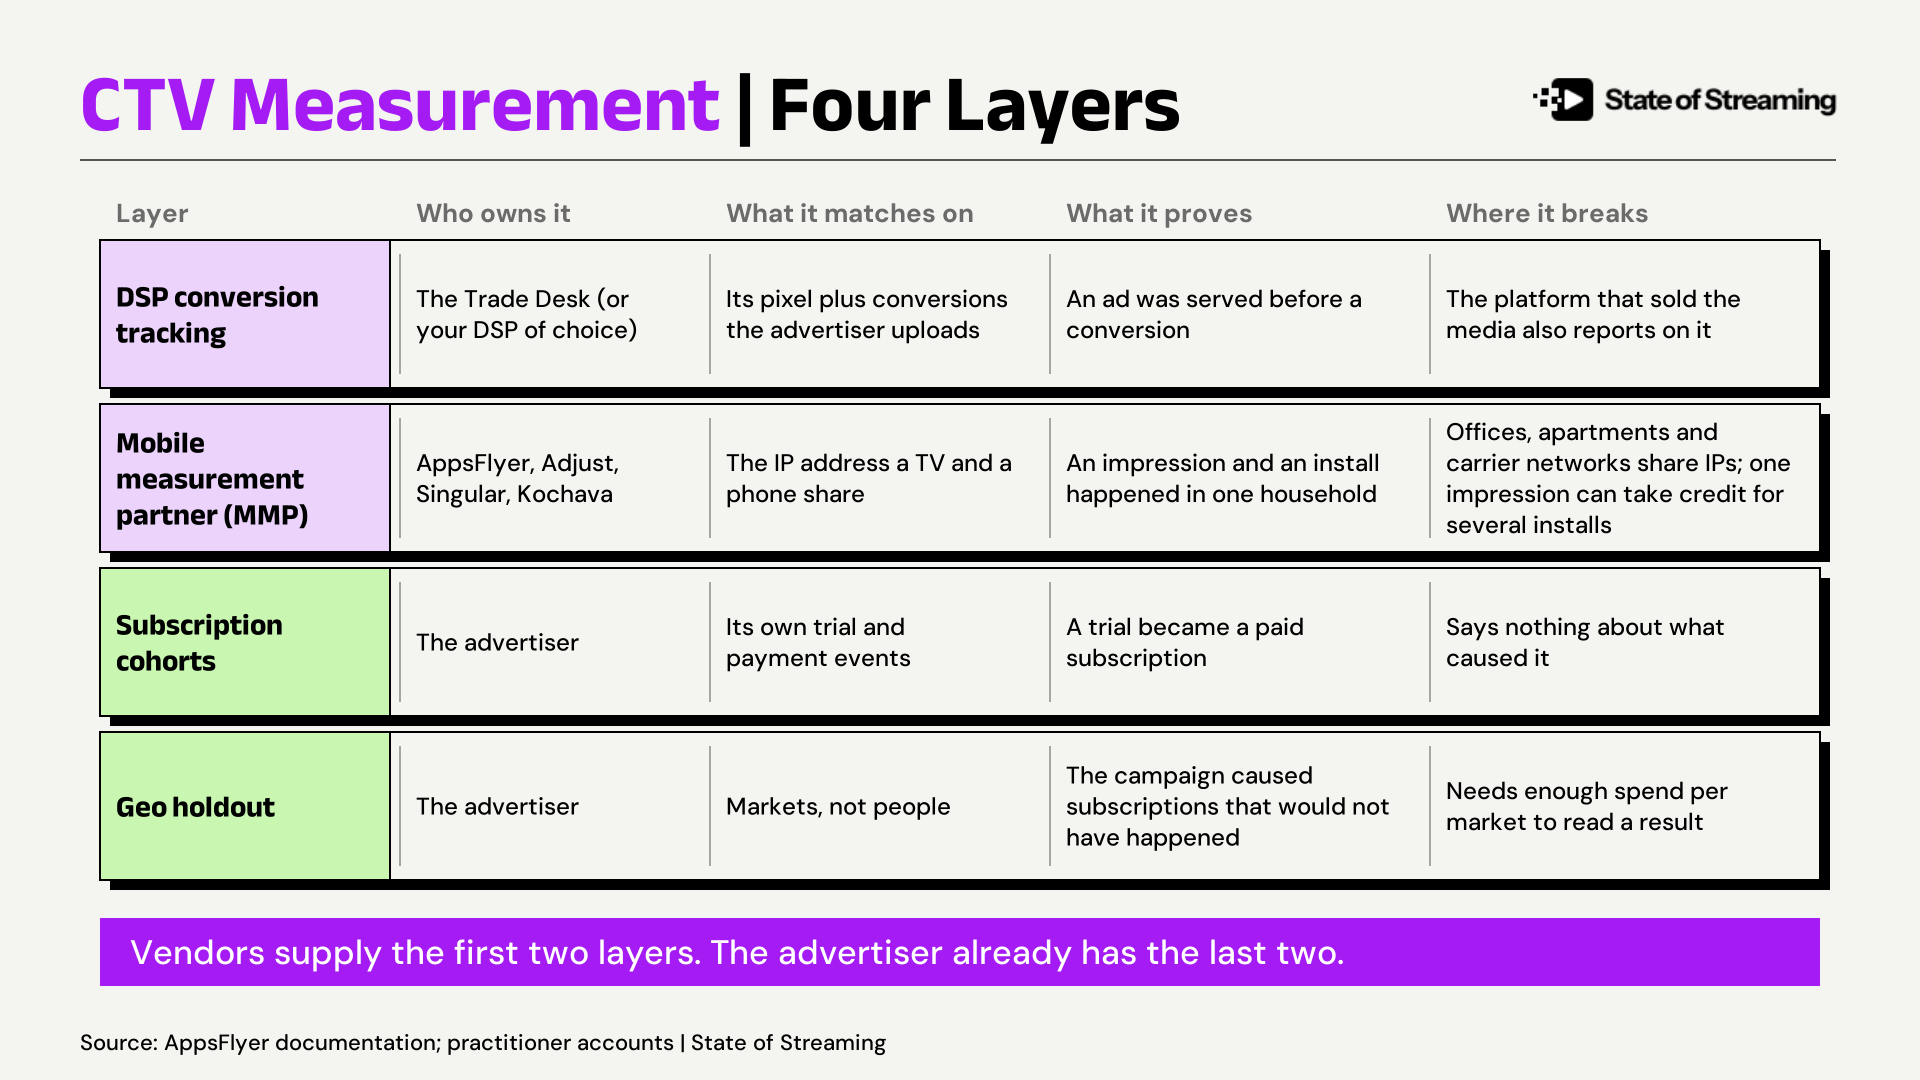
Attribution is one of four layers a marketer can use. Each proves something different.
The trade-offs
Attribution is fast and detailed. It reports by creative, publisher and day, which makes it useful for steering a live campaign. Its totals depend on settings the advertiser chooses.
Settings change the count. By default a measurement platform ranks a TV impression below a later click, so the click takes the credit. An equal-priority setting raises CTV-attributed installs. A shorter view-through window lowers them. Neither setting is wrong. Each answers a slightly different question.
A holdout is causal and slow. It compares subscriptions in markets that got the ads with markets that did not, so no household has to be identified. It needs enough spend per market to produce a readable result, and it returns one answer for the campaign, not one per placement.
Holdout tools differ. Open-source packages exist for designing and reading geo tests. A simulation study by Recast found they do not give identical answers on the same data.
Beyond last-click: Shapley and Markov
The marketer in the scenario worried about branded search taking credit it did not earn. That is last-click attribution. A last-click report gives the whole conversion to the final touch, and it favors whichever channel closes the path.
Multi-touch models split the credit across every touchpoint in the customer journey. Shapley and Markov are two common models for allocating that credit.
Shapley: Borrowed from game theory. It treats each marketing channel as a "player" and the conversion as the "payout" to distribute. It evaluates every possible ordering and subset of touchpoints to measure how much a channel improves conversion odds when added versus left out
Markov: Treats each journey as a network of states (e.g., Start → CTV → Social → Search → Conversion or Null) using actual observed transition probabilities. A channel's credit is its removal effect: how many conversions would be lost if that channel were taken out of the conversion path?
The two charts below show one advertiser's results under each model. Each bar is the change in a channel's share of credit compared with last-click, in percentage points (pp).
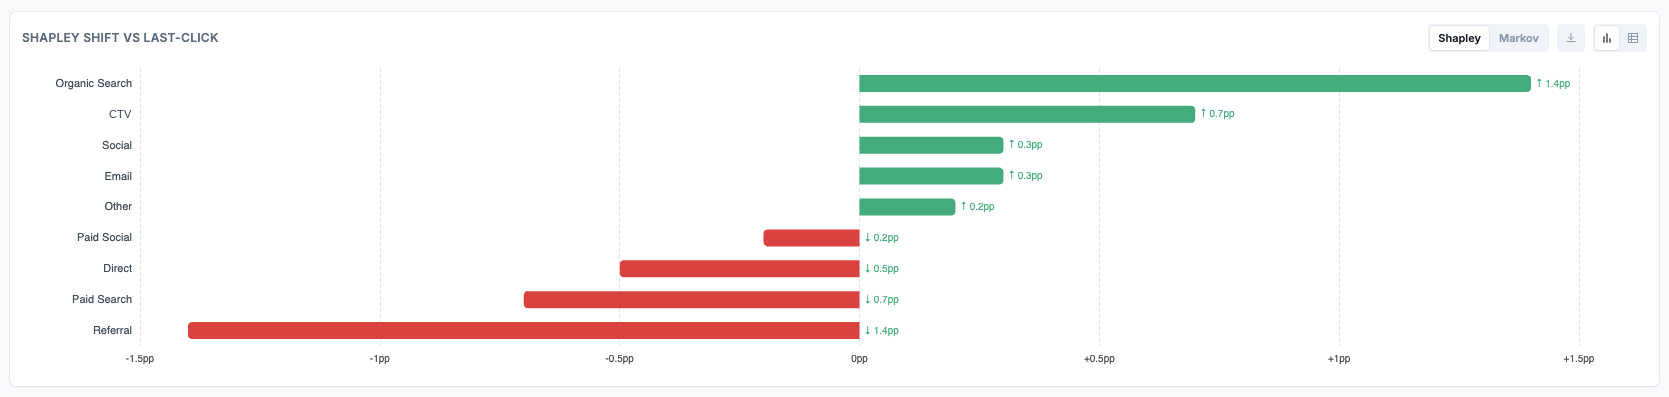
Shapley shift against last-click. Organic search gains 1.4 points; referral loses 1.4. Source: Arpeggio.
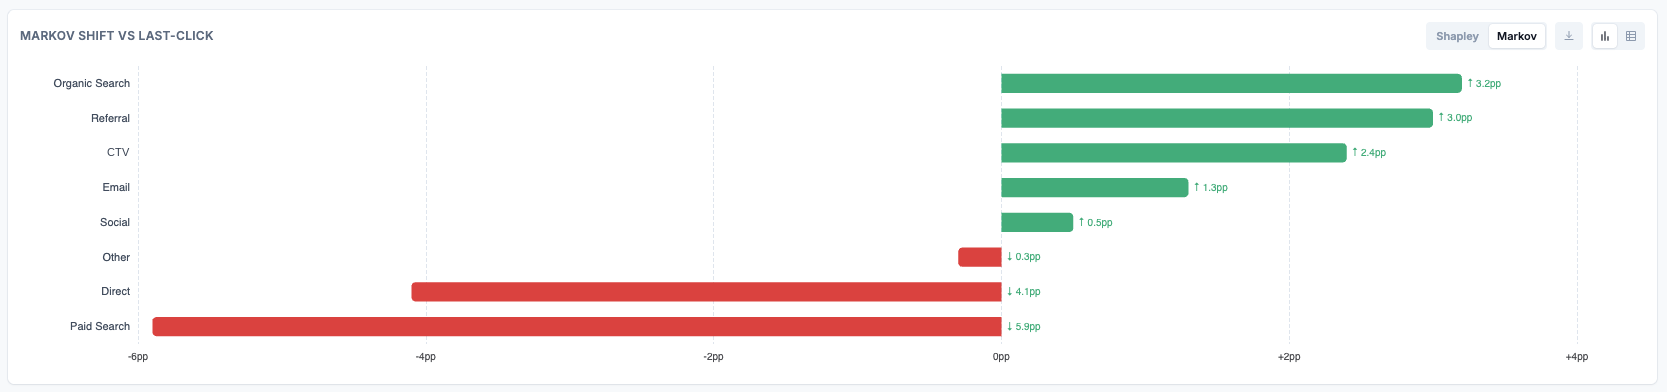
Markov shift against last-click. Organic search gains 3.2 points; paid search loses 5.9. Source: Arpeggio.
What the charts show
A green bar means the model gives that channel a larger share of the credit than last-click did, and a red bar means a smaller share. Nothing here counts conversions or revenue. The charts show credit moving from one channel to another.
Read that way, both charts say the same thing: last-click is over-crediting the channels that close a sale and under-crediting the ones that come earlier. Paid search and direct lose share under both models. Organic search, CTV, email and social gain under both. In this example, CTV picks up 0.7 points under Shapley and 2.4 under Markov.
For CTV, that is the expected pattern because nobody clicks a TV ad. Someone sees it, then searches for the brand or types in the address later, and last-click hands the sale to search or direct. The multi-touch models redistribute credit to what drove the outcome.
Shapley’s largest move is 1.4 points and Markov’s is 5.9. They also split on referral, which loses 1.4 points under Shapley and gains 3.0 under Markov. So the charts support the claim that last-click undercounted CTV contribution, but the scale of the undercount depends on the model.
Common mistakes to avoid
Optimizing to installs when the goal is paid subscriptions.
Comparing vendors on attributed totals without matching their windows.
Reading an IP match as a match to a person.
Spreading a small budget across too many markets to detect a lift.
Ending the readout before the last trial cohorts have had time to pay.
The playbook
Design the holdout before choosing a vendor. Concentrate spend in fewer test markets and exclude the control markets in the DSP. Open-source tools such as Meta's GeoLift handle market selection and power analysis.
Make the vendor show its work. Ask what share of attributed subscriptions came from an IP match and how shared IPs are handled. Ask for one-day, three-day and seven-day windows from the same log data.
Watch branded search in both sets of markets. If CTV is working, the lift often appears there first.
Lock the cohort cutoff before launch. Late cohorts have fewer days to pay and will look worse. Report them separately and follow paid conversions at 30, 60 and 90 days.
Buy a pilot, not a year. Price it per campaign. The finance export is conversion ID, match type, impression timestamp and subscription event, with the holdout result beside it.
Questions to ask
Put these to any measurement vendor before signing.
What share of attributed conversions came from an IP match, and what share from a deterministic match?
How do you treat shared IP addresses such as offices, apartments and carrier networks?
Can I see the same conversions under one-day, three-day and seven-day windows?
How does a CTV impression rank against a click from another channel, and can I change that?
What fields are in the raw export?
Will you price a single-campaign pilot?
Key Terms
Mobile measurement partner (MMP): a platform that credits app installs and in-app events to the ads that preceded them.
View-through attribution: credit given to an ad that was seen but not clicked. It is the only kind a TV ad can earn.
Lookback window: how long after an impression a conversion still counts. A longer window means more credit.
Probabilistic match: a link between two devices inferred from a shared signal such as IP address. A deterministic match uses a known ID or login.
Incrementality: the conversions an ad caused, as opposed to the conversions that followed it.
Last-click attribution: giving all the credit for a conversion to the final touch before it.
Multi-touch attribution: dividing the credit among every touch in the path. Shapley value and Markov chain are two methods for doing it.
Geo holdout: an experiment that withholds ads from some markets and compares results with markets that got them.
Ready to learn about Performance CTV and attribution?
Get our exclusive interview with Jason Fairchild, CEO of tvScientific by Pinterest here.
Get the SOS. Brief
The sharpest streaming intelligence, delivered to your inbox.