Streaming's New Rule: Owning Content Beats Renting It - August USPI Update
Key Takeaways
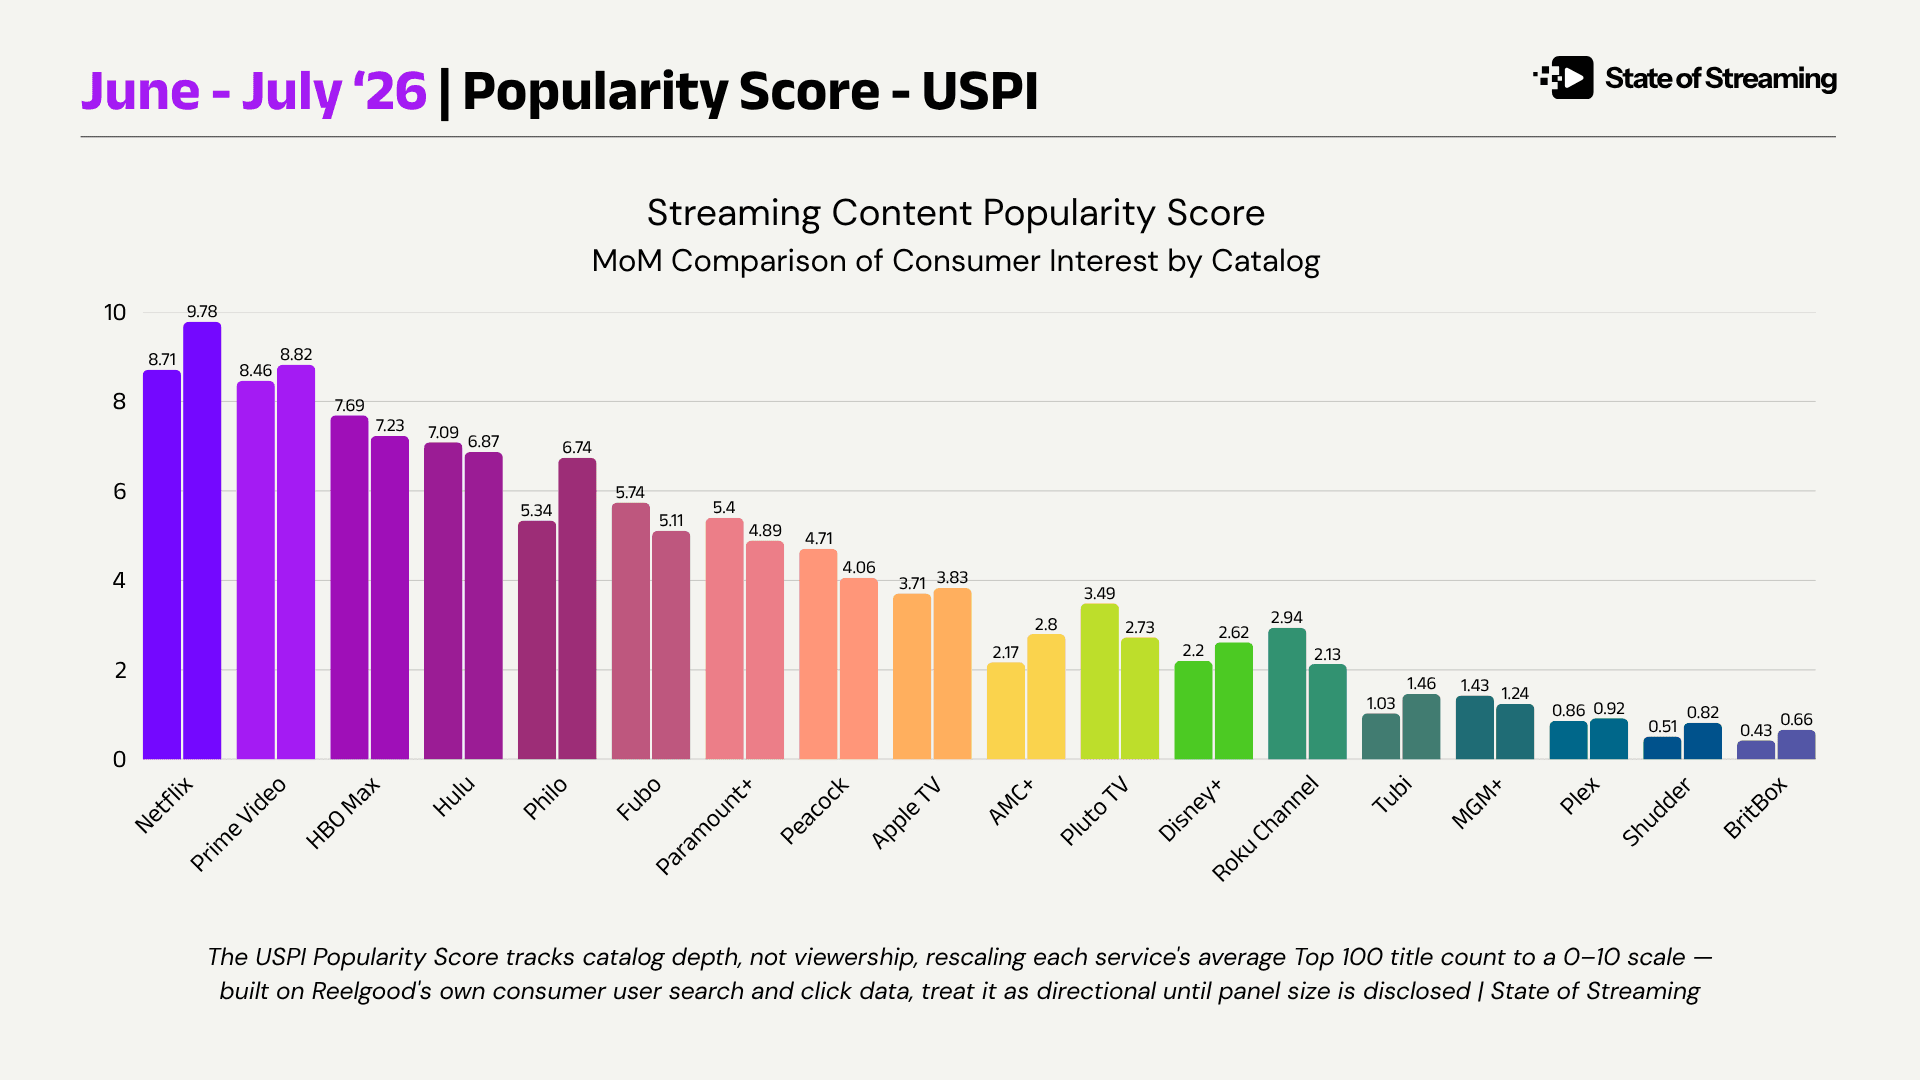
The USPI adds a new vector this month, the Popularity Score, ranking streaming apps by consumer interest and how it shifts month to month.
Philo and Fubo beat Paramount+, Peacock, Disney+, and Apple TV this month on content neither of them owns.
August's USPI moves from a historical view to a forward-looking one, built around what actually matters to media buyers and sellers.
Philo doesn't make TV shows. Fubo doesn't either. Neither owns a single title that made it one of the most in-demand names in streaming last month. That's the gap the USPI just built a number to expose.
Starting today, the Unified Streaming Power Index adds a new vector built with Reelgood: the USPI Popularity Score.
How It Works
Popularity Score measures a service's titles in the national Top 100 every day for a month and averages it out. Not the single biggest hit. The full catalog.
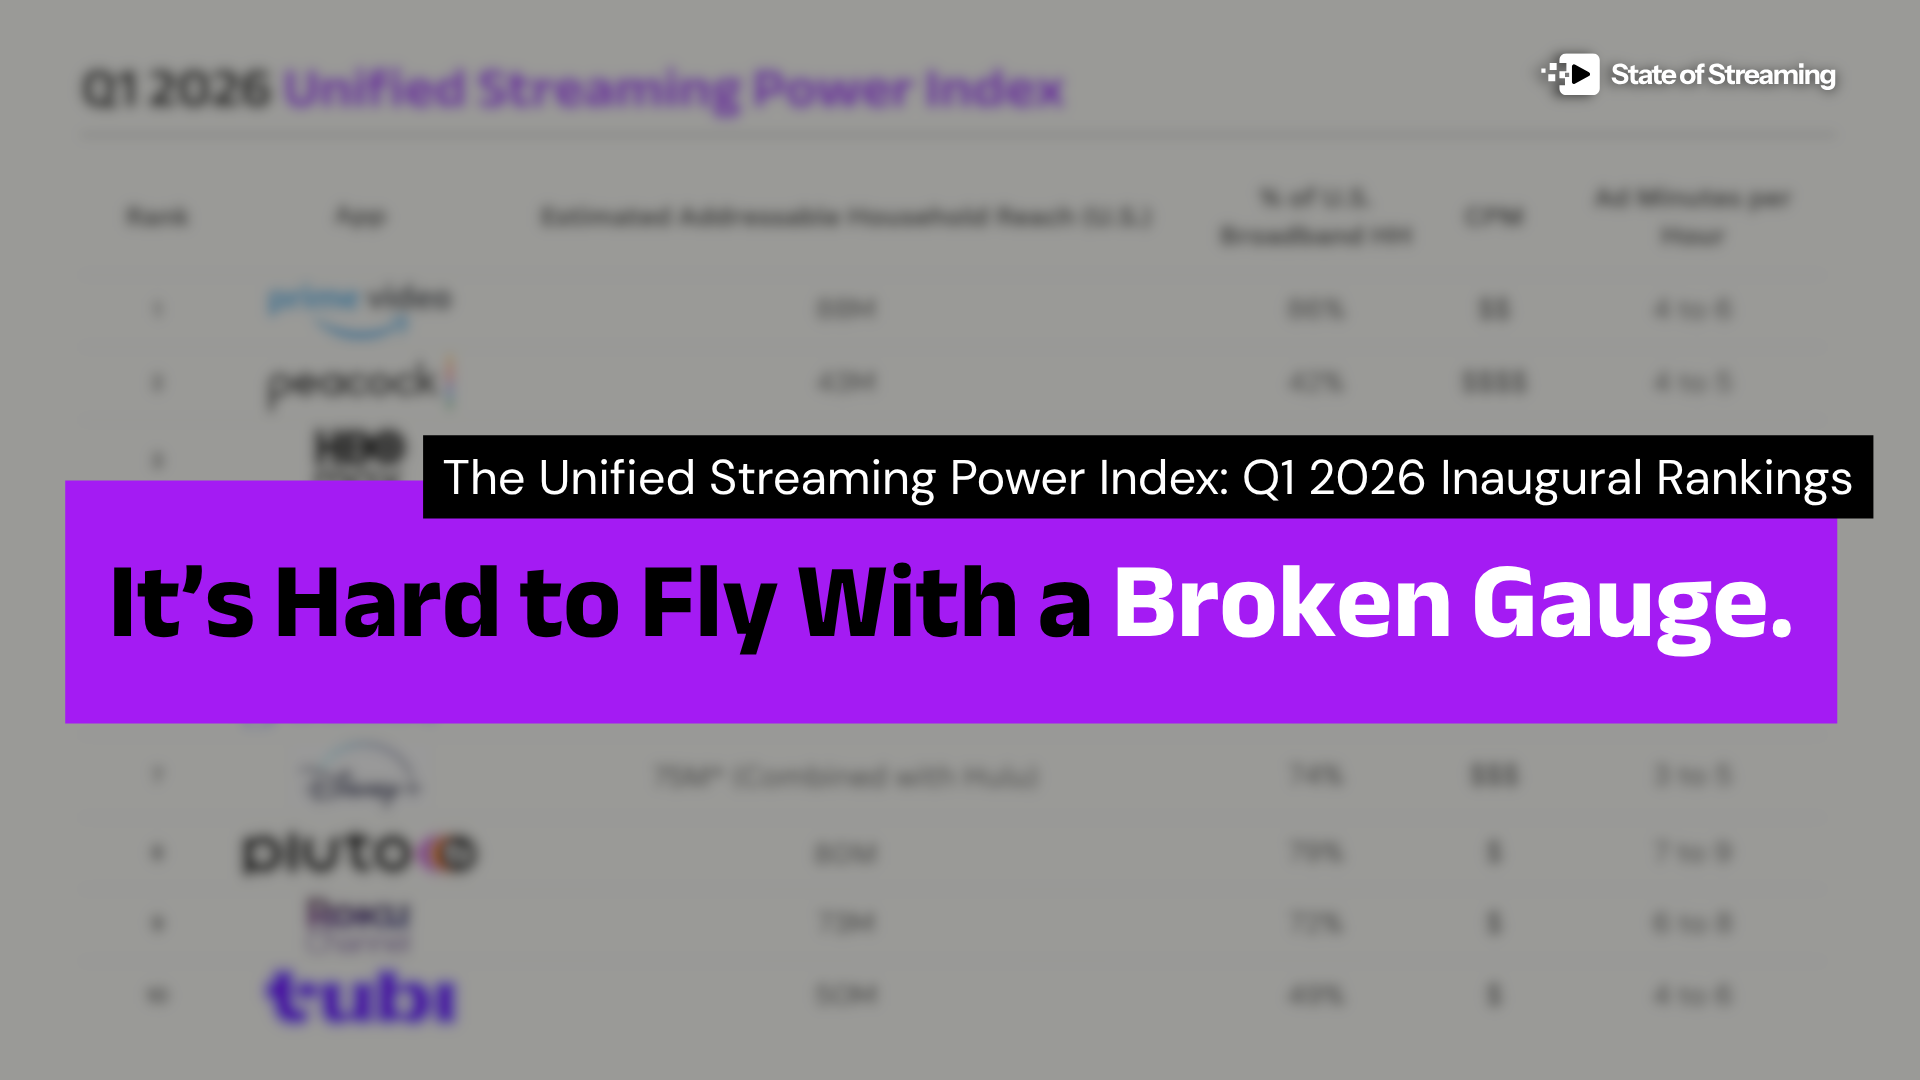
Back in Q1, HBO Max posted a perfect 'content heat' score. In reality, two shows were carrying that entire number — see for yourself in the Q1 rankings.
We've spent the months since figuring out what actually signals durable attention in streaming. The Popularity Score is the our initial pass at solving that.
August's USPI will be the second — the first fully forward-looking edition of the index, built to project where attention is headed instead of just where it's been.
The Methodology
Run the math and the board splits into two groups: owners and renters. Owners built what they're selling — Netflix, Prime Video, HBO Max, Hulu, Paramount+, Peacock, Apple TV, Disney+, and the rest of the catalog-first names. Renters are reselling someone else's content inside their own interface. Philo repackages cable channels. Fubo does the same. Roku's Premium Subscriptions tier bundles Paramount+, AMC+, STARZ, and MGM+ under Roku's own billing — none of it Roku's content.
Same score. Different ownership. Only one side controls what happens to it next.
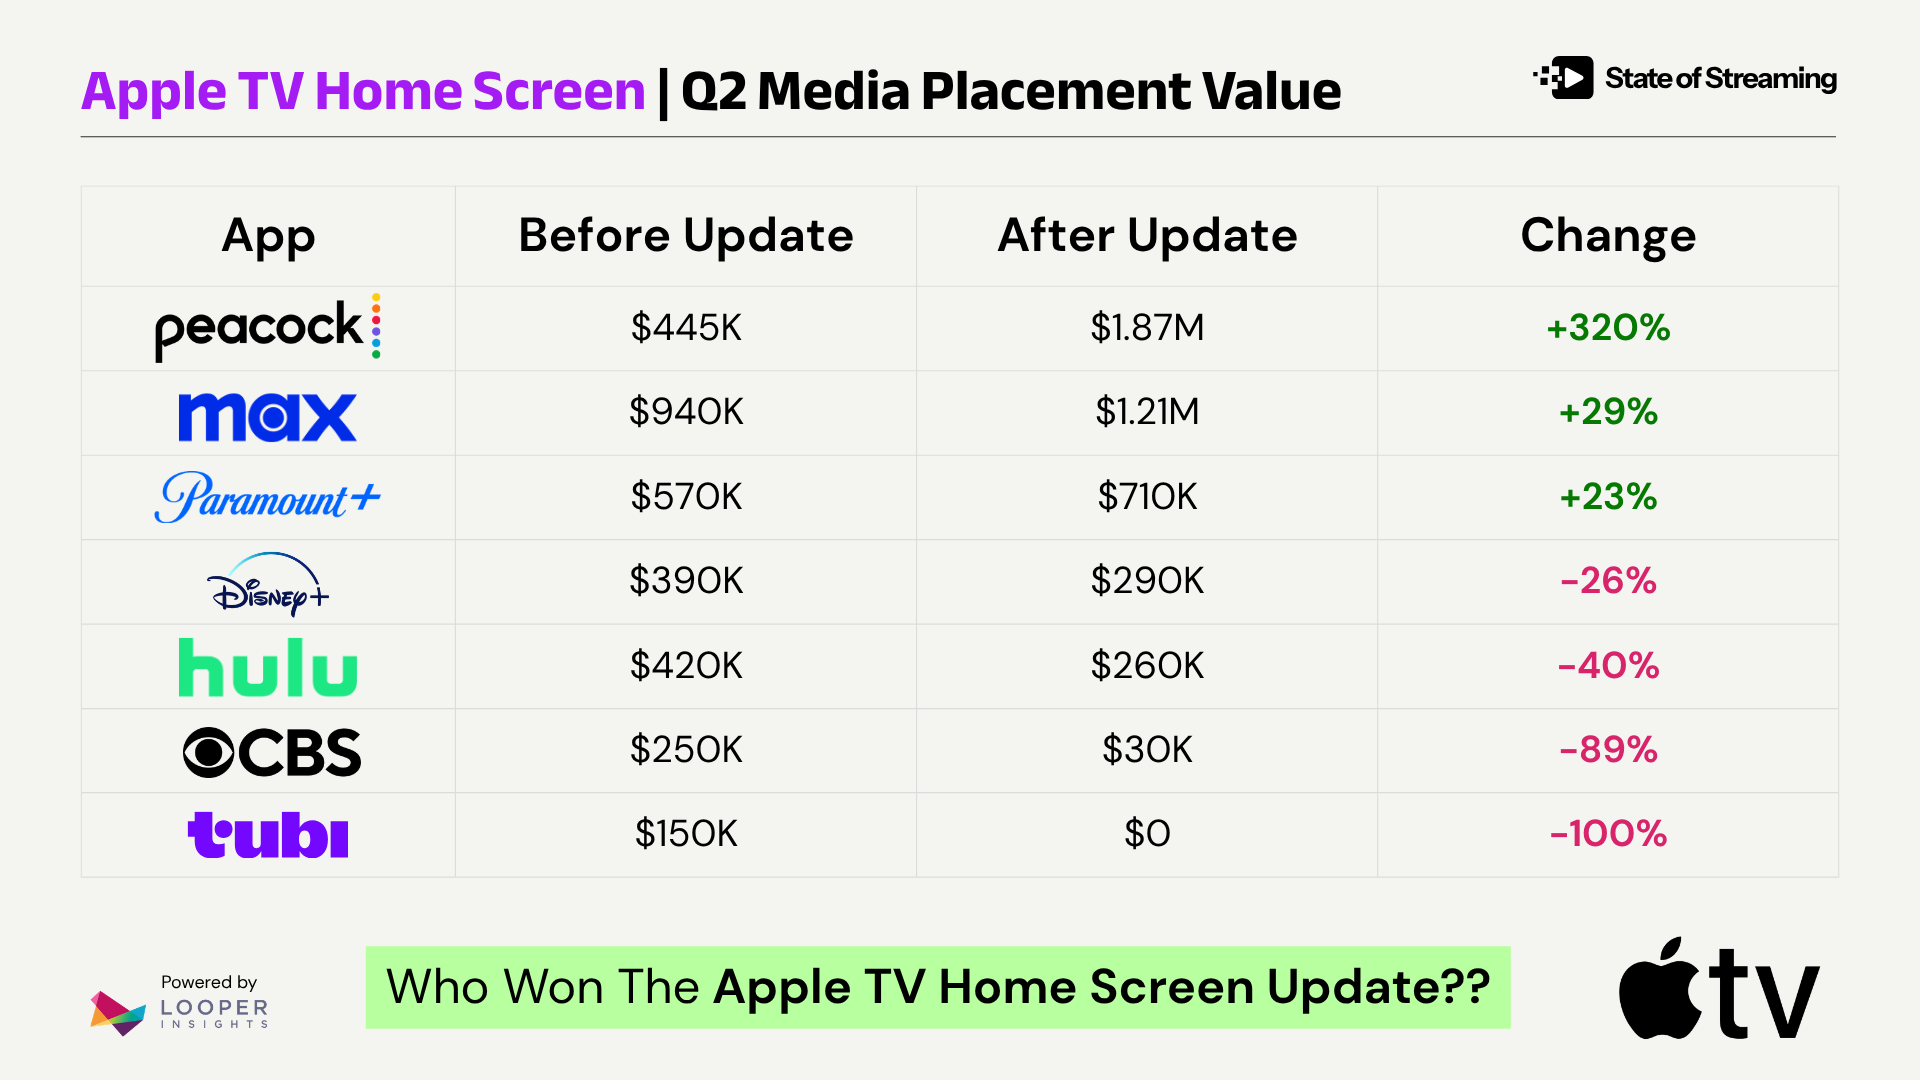
Owners hold the position everyone assumes: real catalogs, real depth, no wrapper risk. Their scores only move when their own content demand changes. Apple TV sits in this group with one caveat worth flagging — it isn't sold as an ad network today, but its home-screen placement still shapes which shows actually get seen. Reading the Tea Leaves covers how that played out for Peacock's shelf space after Apple's redesign.
Renters — Philo, Fubo, Roku Premium — post real numbers on content they don't control. Strong scores until the day a carriage deal ends or a network pulls out. Notably absent from this first index: YouTube TV, the largest live-TV wrapper in the market. Expect that gap to close next month.
Media buyers should read this as a stability signal. A service with two dozen owned titles in demand is a repeatable buy. A service reselling somebody else's channels is one contract renewal away from a different number.
One caveat, stated plainly: this is a demand signal, not a viewership number. Reelgood tracks what its own users search for and click toward, not confirmed watch-time off a national panel. As with the USPI itself, we believe the data is most useful in this form as directional.
Why Subscribe
The Popularity Score is one data point. The August USPI puts it to work — the first forward-looking edition of the index, built to project which platforms hold their ground and which are one contract away from losing it. Subscribe below to get the full ranking next week and what State of Streaming expects to move next.
Get the SOS. Brief
The sharpest streaming intelligence, delivered to your inbox.