The Streaming Shelf Doesn't Lie: New Looper Insights Quarterly Report
Key Takeaways
The Milan Cortina 2026 Olympics generated $36.3M in $MPV across 12 platforms simultaneously — more than double any other Q1 property and more than March Madness and the full MLB campaign combined. Total-market saturation, not just premium placement.
Strip the Olympics out and Q1 was a compressed, competitive market. Seven properties finished within $7 million of each other, with March Madness outperforming full-season leagues in three weeks.
Placement and audience don't always move together. The NBA received near-NHL shelf space while broadcast ratings fell sharply — the gap between home screen position and actual viewership is the measurement problem Looper Insights is solving.
For two weeks in February, the Milan Cortina 2026 Winter Olympics took over every premium surface on every major streaming platform simultaneously.
Defining A Metric: Media Placement Value ($MPV)
Think of $MPV as the streaming equivalent of retail shelf placement. Every retailer knows the end-cap moves product. Eye level sells fast. The bottom shelf sells more slowly. $MPV measures which sports properties got the end-cap, which got eye level, and which got the bottom shelf in the middle of the aisle — across every major streaming platform at once. Looper Insights tracks $MPV across 12 connected TV platforms, including Roku, Fire TV, Apple TV, Google TV, Samsung TV, and PlayStation.
NBCU Maxed Out Milan Cortina Olympics
The Milan Cortina Games generated $36.3 million in $MPV across the quarter. That is more than double the next closest property. More than NCAA March Madness and the entire MLB regular-season campaign combined.
In February alone, the Olympics commanded nearly ten times the placement value of the second-ranked event.
Every premium home screen surface, on every major platform, pointed to the same property at the same time. That kind of total-market saturation has no equivalent in a normal sports quarter.
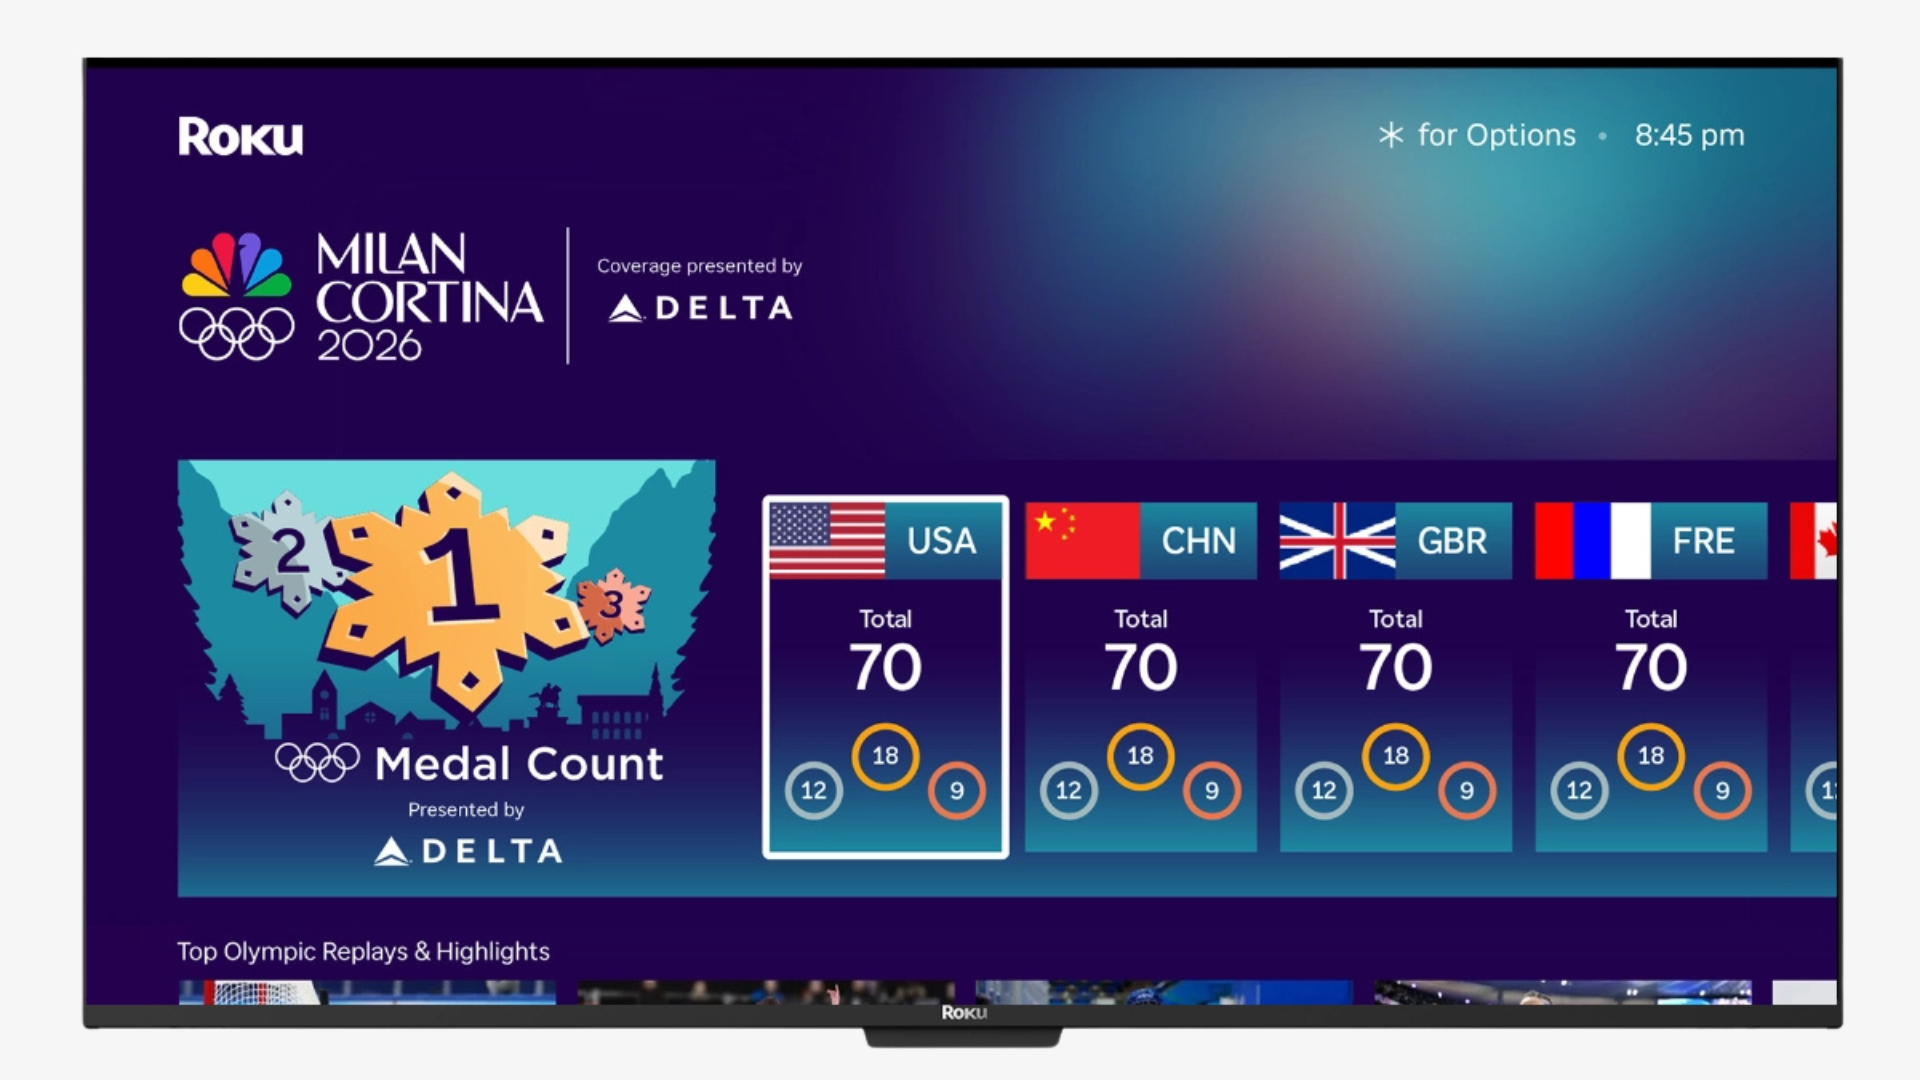
The Roku execution illustrates how that dominance was built at the platform level. NBC and Peacock didn't get a tile in a generic row. They got a fully branded destination hub, co-branded with Delta in the masthead, a 40-deep "Featured Events" carousel surfacing live start times in real time, and a direct path from the home screen into the broadcast. That single placement was worth $192,900 in $MPV on its own. Roku was one platform. Eleven others ran similar Olympic priority logic across their own surfaces.
The compression effect on everything else is the part that matters for media buyers.
Strip the Olympics out and Q1 was a well-stocked sporting goods store where no single brand owned the floor. Seven properties clustered within $7 million of each other, competing for whatever premium shelf space the Games didn't occupy:
NHL: $15.4M
NBA: $15.1M
NCAA March Madness: $12.0M
Formula 1: $9.6M
MLB: $8.9M
NCAA Men's College Basketball: $8.6M
Liga MX: $8.1M
March Madness is the counterintuitive result. Three weeks of tournament basketball outperformed properties running full-season campaigns. The Women's Championship alone drew 9.9 million viewers on ESPN, up 15% year over year, per the State of Streaming viewership tracker. Platforms saw that audience building and allocated shelf space to accommodate it. A well-merchandised, concentrated tentpole event, beats a year-round product that never owns the end-cap. Liga MX finishing above MLS and the Premier League tells the same story from a different angle.
The NBA number is worth a separate look. Platforms merchandised the league at near-NHL levels even as NBA Saturday Primetime broadcast ratings fell 21% year over year, per the SOS. viewership tracker. Placement and audience don't always move together though. That gap — between where a property appears on the home screen and the value it generates — is exactly what Looper Insights solves for.
The broadcast deal gets rights holders in the building. Placement design determines what happens at the shelf. And with the World Cup build-up upon us, the platform-level merchandising decisions being made right now will determine which properties get the end-cap when the stakes are highest.
State of Streaming is partnering with Looper Insights CEO Lucas Bertrand for a quarterly analysis series. Subscribe below to get it when it publishes.
Get the SOS. Brief
The sharpest streaming intelligence, delivered to your inbox.