The World Cup's Viewership Record Numbers Have a Footnote. This is the Footnote.

Nielsen revised Telemundo's first-week viewership figures downward by 25 to 29 percent, mid-tournament, with no public explanation — and nobody who bought advertising against those original numbers has been formally told why.
Fox's numbers are not in dispute.
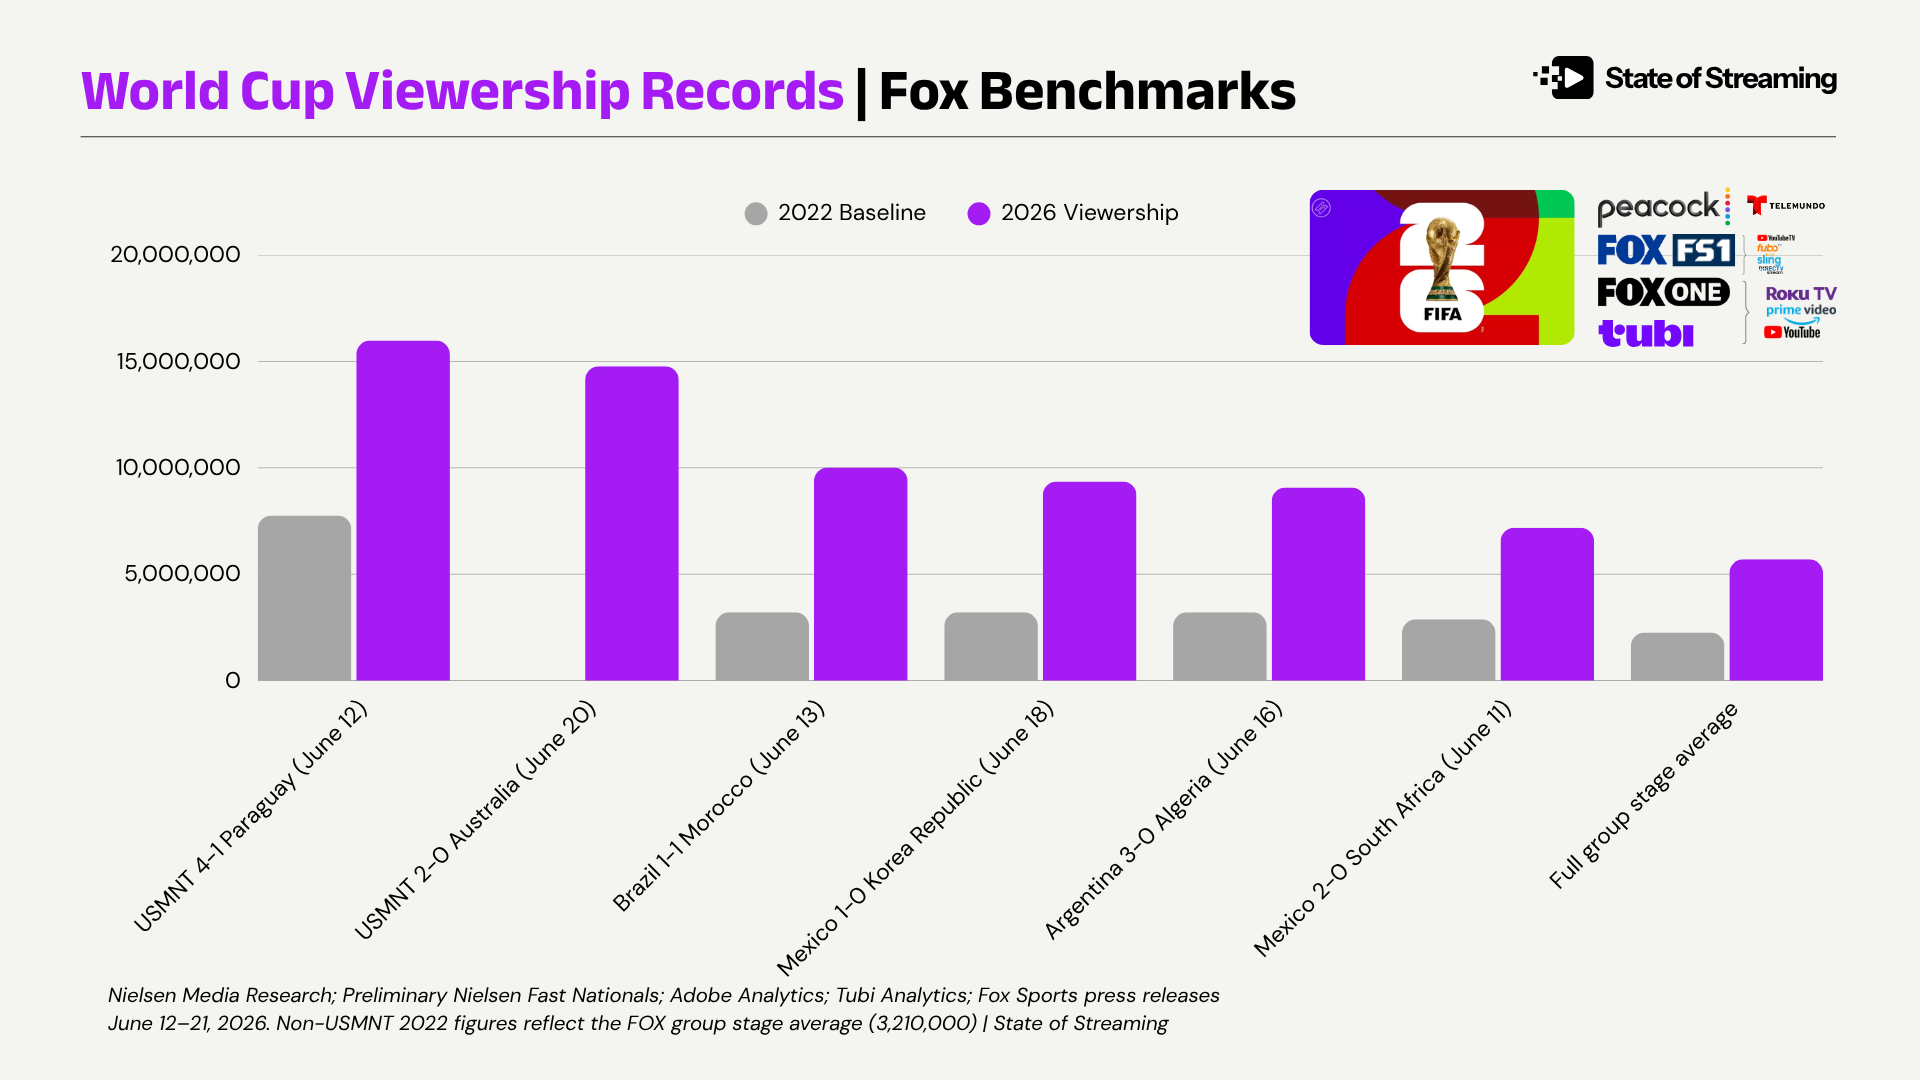
14,781,000 viewers watched USMNT defeat Australia 2-0 on June 20 — the best Friday afternoon telecast on any broadcast network since 2022, and the third most-watched FIFA Men's World Cup Group Stage match in English-language U.S. history, peaking at 19,169,000 viewers from 4:45 to 5:00 PM ET.
Across the full group stage, Fox Television Network, FS1, and Tubi are averaging 5.7 million viewers — up 116% from 2022 — measured via Nielsen Big Data + Panel and Adobe Analytics.
The Records Fox Is Actually Breaking
Non-USMNT matches — English-language records on FOX:
Brazil 1-1 Morocco (June 13): 10,019,000 viewers
Most-watched non-USMNT FIFA Men's World Cup Group Stage telecast in English-language U.S. history, up 212% from the 2022 non-USMNT group stage average on FOX (3,210,000 viewers).
Peak audience: 13,119,000 from 7:45–8:00 PM ET. Source: Nielsen Media Research.
Mexico 1-0 Korea Republic (June 18): 9,361,000 viewers
No. 1 telecast in all of television for the day, second most-watched non-USMNT Group Stage telecast in English-language U.S. history, up 192% from the 2022 non-USMNT group stage average on FOX.
Peak audience: 11,547,000 from 10:30–10:45 PM ET. Source: Nielsen Media Research.
Argentina 3-0 Algeria (June 16): 9,082,000 viewers
Third most-watched non-USMNT Group Stage telecast in English-language U.S. history, up 183% from the 2022 non-USMNT group stage average on FOX.
Mexico 2-0 South Africa (June 11): 7,186,000 viewers
Across FOX, FOX One, and Tubi — most-watched FIFA Men's World Cup opening match in English-language U.S. history, up 150% from the 2022 opener on FS1 (Qatar–Ecuador, 2,877,000 viewers).
Peak audience: 9,410,000 from 4:45–5:00 PM ET. Also the most-streamed English-language opening match in FIFA World Cup history. Source: Nielsen Media Research, Adobe and Tubi Analytics.
USMNT matches — English-language records on FOX:
USMNT 4-1 Paraguay (June 12): 15,986,000 viewers
Across FOX, FOX One, and Tubi — most-watched USMNT FIFA World Cup telecast in English-language U.S. history, up 106% from USMNT–Wales on 11/21/22 (7,763,000 viewers).
Peak audience: 18,860,000 from 10:45–11:00 PM ET. Also the most-streamed English-language USMNT match on record (Tubi AMA: 1,130,000). Source: Preliminary Nielsen Fast Nationals, Adobe and Tubi Analytics.
USMNT 2-0 Australia (June 20): 14,781,000 viewers
Best Friday afternoon telecast on any broadcast network since 2022, third most-watched FIFA Men's World Cup Group Stage telecast in English-language U.S. history overall. Peak audience: 19,169,000 from 4:45–5:00 PM ET. Source: Preliminary Nielsen Fast Nationals.
The Revision: What Changed, By How Much, and When
Nielsen revised its viewership estimates for Telemundo from June 11 through June 15 — the first five days of the tournament — downward by 25 to 29 percent across every match in that window.
Here is the full before-and-after:
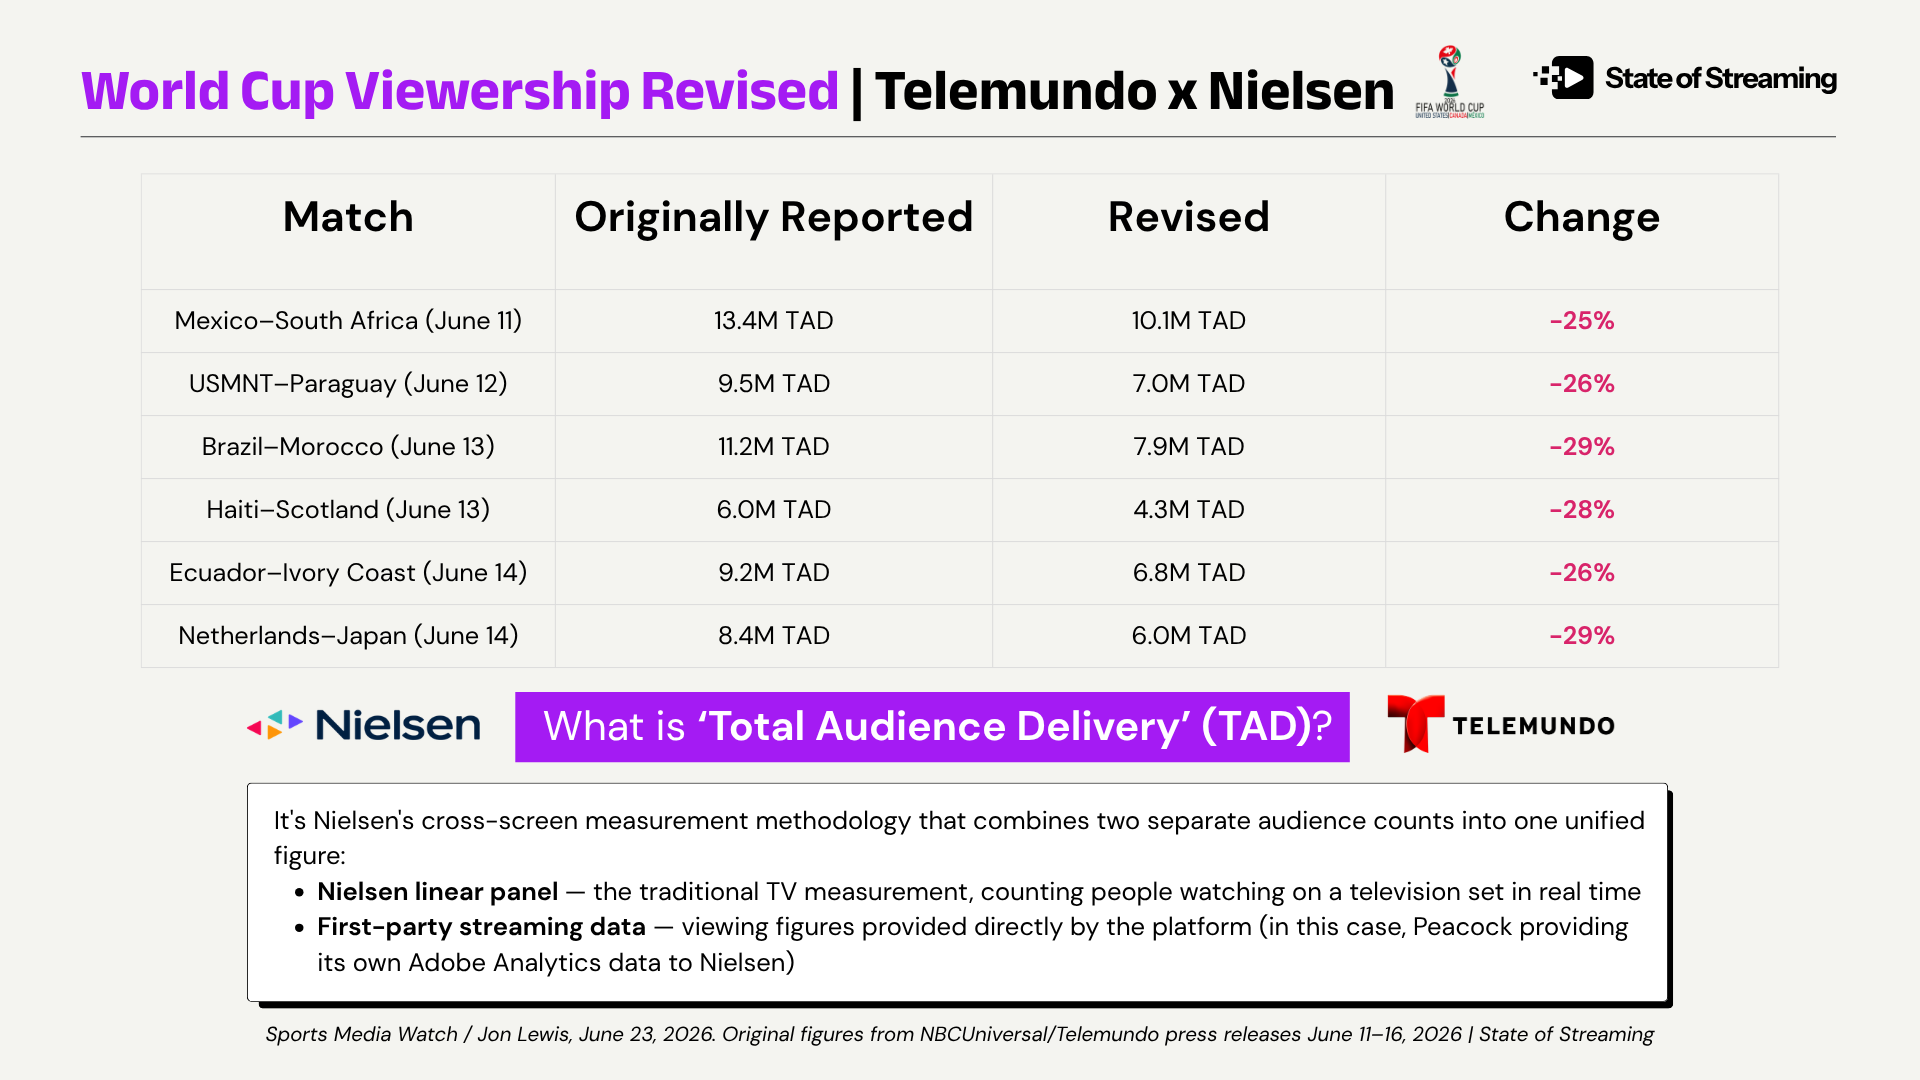
No explanation has been publicly given for the change. Telemundo said the revisions are specific to the Nielsen data component, not the Adobe Analytics streaming figures.
One week after those revisions, Telemundo announced that Mexico–South Korea on June 18 drew 14 million total audience delivery — the most-watched soccer match in Spanish-language history, surpassing the revised 10.1 million from Mexico–South Africa. On Telemundo linear alone, the match delivered 7.2 million viewers — the highest-rated telecast in Telemundo network history — reaching a peak of 8.6 million. The streaming component (also available on Peacock) produced 6.1 million average viewers, also a Spanish-language record.
The record stands. The linear-only figure is clean. The streaming-only figure is separately sourced.
But the combined TAD number is built on the same methodology that just produced systematic inflation and corrected silently — which makes it a different number than it was two weeks ago.
Why This Keeps Happening
This is the third major post-publication Nielsen correction in under a year.
Data was revised after the fact for both the YouTube-exclusive NFL game last September and Super Bowl 60 in February — in both cases because of issues with first-party data providers. Nielsen prior to last year did not include first-party data in its official estimates.
The Structural Failure
Nielsen expanded its methodology to incorporate first-party streaming data from platforms including Peacock, YouTube, and Amazon — the right impulse, because linear-only panels miss the streaming audience
But incorporating first-party data creates a new error type: when the integration fails, it fails systematically, inflating the same metric across every event in a window
And unlike random panel noise — which is detectable, self-correcting, and statistically bounded — systematic inflation is invisible until someone catches it manually
So double-counting is the only plausible explanation: Nielsen can track NBCU's streaming numbers, but those are not supposed to be included in the reported data. The question, as analysts noted, is whether those numbers "aren't included" or "aren't supposed to be included."
The distinction between those two phrases is the accountability problem and no one is addressing it publicly.
The Asymmetry Between Fox and Telemundo
There is a meaningful methodological difference between how the two rights holders are publishing their numbers. It has direct implications for anyone pricing knockout round inventory.
Fox
Publishes Nielsen Fast Nationals match-by-match within 48 hours
Sources to Nielsen Big Data + Panel combined with Adobe Analytics
Provides explicit 2022 comparison figures for every match
All figures stable, unrevised, directly comparable across the tournament
Telemundo
Has not disclosed comparisons to the 2022 World Cup
Presents TAD figures — a combined metric — without a 2022 baseline
No formal acknowledgment that the entire opening window had been revised (as of 6/25/26)
Linear-only and streaming-only components are clean but the combined figure is not
Fox is showing its work. Telemundo is not. That is not a critique of the coverage — which by any measure has been outstanding. Mexico's second group stage match against South Korea broke the record set by Mexico–South Africa, which itself was the most-watched FIFA World Cup opening game in history regardless of language. The audience is real and historic at any corrected figure.
But "real audience" and "auditable number" are not the same product.
SOS. Insight: Fox's transparency advantage here carries more weight than it did six months ago. In our Fox/Roku analysis, we identified Fox's missing piece as a unified measurement and identity stack — the commercial ceiling that sits below what its audience footprint suggests. That gap is real. But the broadcaster that publishes clean, stable, comparable viewership figures is also the one building the distribution layer underneath all of it. Measurement transparency and distribution control are now on the same stack.
What Buyers Should Do Right Now
Three operational steps for anyone with knockout round inventory commitments:
1. Separate the components before pricing anything.
TAD is a combined figure. Its components are individually clean. Price them that way:
Telemundo linear-only → priced against Nielsen linear-only figures (independently sourced, not in dispute)
Peacock streaming-only → priced against Adobe Analytics streaming-only figures (also separately sourced)
Do not use the combined TAD figure as a single planning metric for any commitment until the methodology completes a major event without a mid-tournament correction
2. Demand the denominator on any pitch.
When a broadcaster pitches TAD for knockout round inventory, ask two questions before accepting the number:
Which component — Nielsen linear panel or first-party streaming data — drove the figure, and in what proportion?
What is the formal correction policy if either component is revised post-campaign?
"We use Nielsen Big Data + Panel and Adobe Analytics" is not an answer to either question. A specific split and a written correction policy are.
3. Watch Fox's knockout round trajectory independently.
The Fox number for USMNT–Australia is 14,781,000. Tonight's USMNT–Türkiye match kicks off at 10:00 PM ET on FOX from Los Angeles, with coverage starting at 9:00 PM. If the U.S. advances — and they enter tonight already qualified — the Round of 32 match could approach or exceed the USMNT–England record from 2022. Fox scatter in that window will be priced accordingly. The measurement risk is near zero. Price knockout round Fox inventory against this clean baseline and you have an auditable anchor for every subsequent commitment.
SOS. Insight: This is the same accountability gap performance TV is trying to solve from the other direction. Walmart's Vibe.co acquisition is built on the premise that closed-loop attribution — what you watched, what you bought — is more valuable than reach measured by a methodology that can be revised 25% after the campaign runs. TAD and performance TV are heading toward the same reckoning from opposite sides of the market.
The Structural Problem TAD Was Built to Solve — and Hasn't
The idea of TAD is to solve cross-screen fragmentation. Linear and streaming audiences needed a common currency so buyers could evaluate total reach without double-counting. Right problem. Right concept.
But the implementation requires combining a Nielsen panel built for linear TV with a first-party data stream provided by the platform. When the integration fails, it fails silently and systematically — and corrections arrive after commitments have been made, without methodology explanations, without buyer notification, and without a named accountable party.
Russell Fink has been making this argument for two decades. The 2026 World Cup is running it in public, at scale, for the first time.
The audience is genuinely the largest in American soccer history but the methodology to quantify it reliably is still being built. That gap — between the scale of what's happening on screen and the industry's ability to account for it with precision — is the measurement story of this tournament.
Key Takeaways
The revision is systematic, not incidental.
Nielsen corrected Telemundo's entire opening week downward by 25–29% with no public explanation. This is the third major post-publication correction in under a year — a pattern, not an anomaly.
TAD's components are clean. The combined figure is not.
Price Telemundo linear against Nielsen linear-only data. Price Peacock streaming against Adobe Analytics data. Do not use TAD as a single planning input until the methodology produces a major event without a mid-event correction.
Tonight's USMNT–Türkiye match (10 PM ET, FOX) is your knockout round pricing anchor.
Whatever it produces will be published within 48 hours, unrevised, directly comparable. Use it as the measurement baseline for every subsequent Fox scatter commitment through July 19.
Read 'A Tale of Two Cups' next
Get the SOS. Brief
The sharpest streaming intelligence, delivered to your inbox.