June USPI: Three Macro Themes Shaping the Unified Streaming Power Index (USPI)
The June 2026 Unified Streaming Power Index (USPI) arrives during the densest live-sports broadcast window in history. With the NBA Finals, Stanley Cup Final, and the FIFA World Cup colliding across the ecosystem, consumer demand is at an all-time high.
However, the real story for media buyers isn't which specific app or platform holds the top spot. Instead, this month's index reveals three structural shifts that are rewriting the rules of how streaming audiences connect with their television, how they find content, and how advertisers attribute performance.
Theme 1: The Portals Are Swallowing the Catalogs
For years, "the streaming wars" were treated as a battle of content libraries — whoever owned the best movies or the buzziest scripted dramas won the subscriber. June 2026 proves that era is over. Today, the portal is the product, and the home screen is the transaction layer.
As premium content fragments across dozens of apps, consumers face profound choice fatigue. In response, operating system (OS) environments and hardware manufacturers — like Roku (#1), Samsung (#10), LG (#11), and Vizio (#12) — have become the primary discovery engines. They own the "front door" real estate where viewing decisions are made.
The Advertiser Implication: Relying solely on in-app video inventory means missing the critical first 60 seconds of the consumer journey. Native home-screen display ads, curated sports hubs, and CTV-level recommendations are are essential top-of-funnel buy-ins required to guide audiences before they disappear into fragmented, sometimes ad-free premium environments.
Theme 2: The Core Vulnerability of the "Wrapper" Model
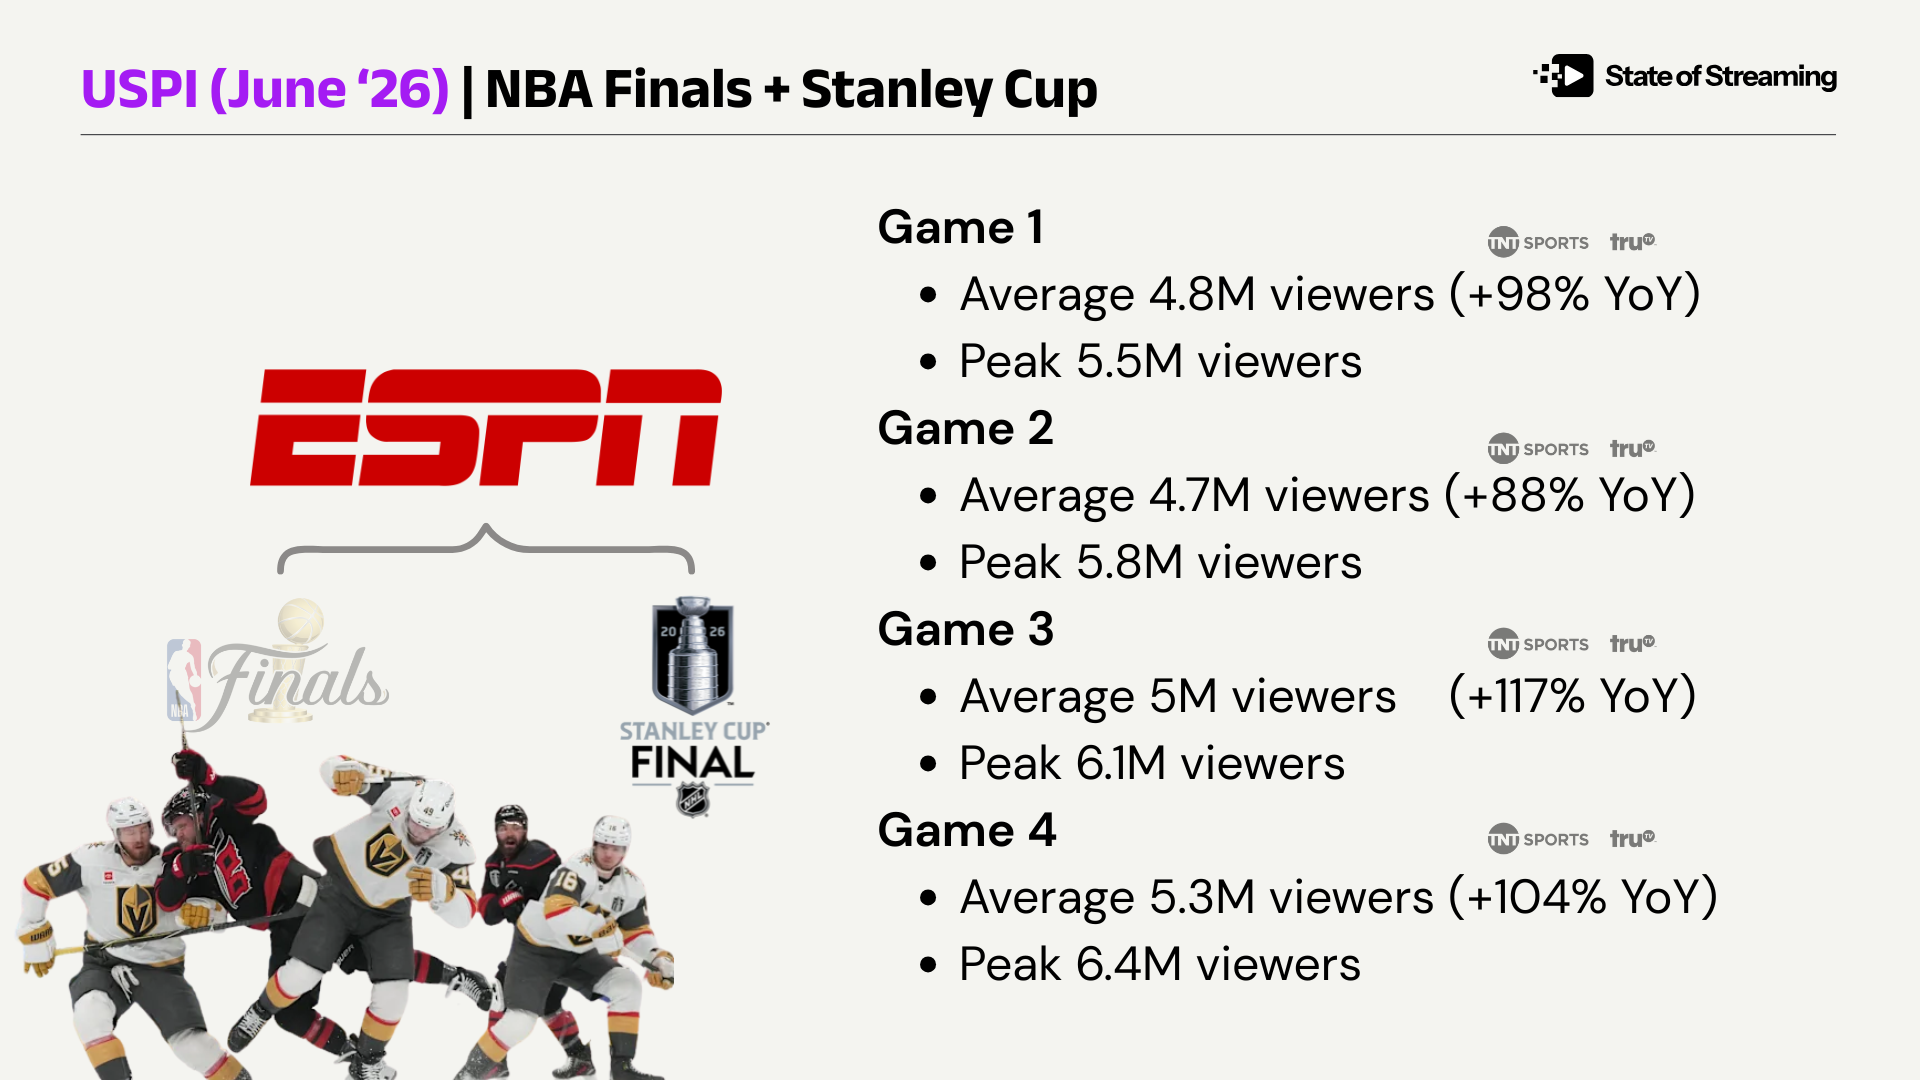
Live sports remains the ultimate glue of television, accounting for the vast majority of top-rated telecasts. However, the index highlights a severe economic disparity between the companies that own sports rights and the live-TV "wrappers" (Virtual Multichannel Video Programming Distributors like YouTube TV, Fubo, and DirecTV Stream) that merely distribute them.
According to Inscape data cited in eMarketer's US Sports Streaming 2025 report, consumers spend roughly twice as much sports viewing time on wrappers as they do on pure streaming apps. Yet, these distributors suffer from a steep discount because the underlying network keeps most of the ad load. The wrapper is left to monetize only thin local and dynamically available ad inventory (or adjacent activations on-platform).
Watch our interview covering this research with Ross Benes, Senior Analyst at EMARKETER
This middleman position carries immense operational risk.
DirecTV Stream’s (#20) catastrophic, mid-series carriage blackouts during Game 1 of the Stanley Cup Final proved that when distribution infrastructure fractures, viewers instantly abandon the wrapper and flee directly to primary destination apps like ESPN (#5).
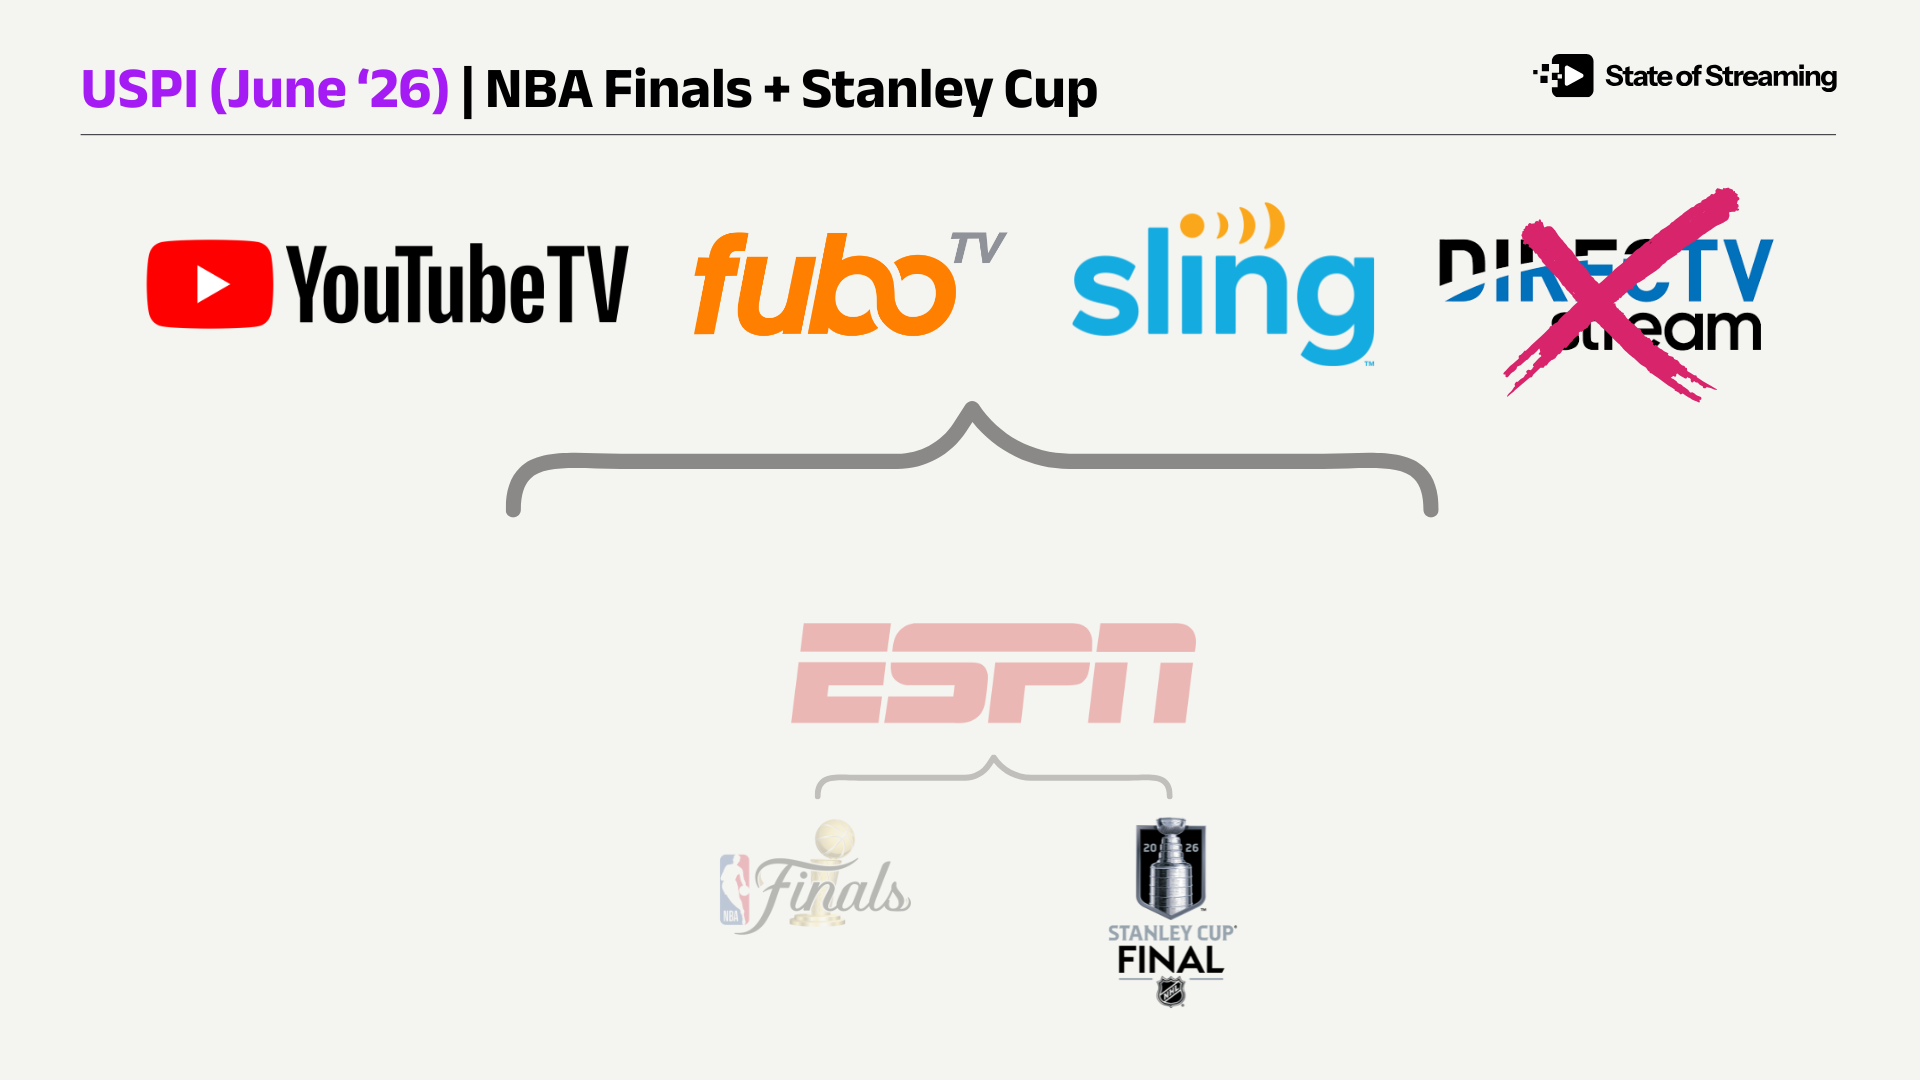

The Advertiser Implication: Mass reach numbers on a wrapper spreadsheet can be deeply deceptive. Buyers should prioritize direct partnerships with native rights-holders—such as ESPN (#5), Peacock (#3), and Fox One (#18)—who command full inventory control, pristine signal reliability, and the ability to flex contextual alignment during premium broadcast windows.
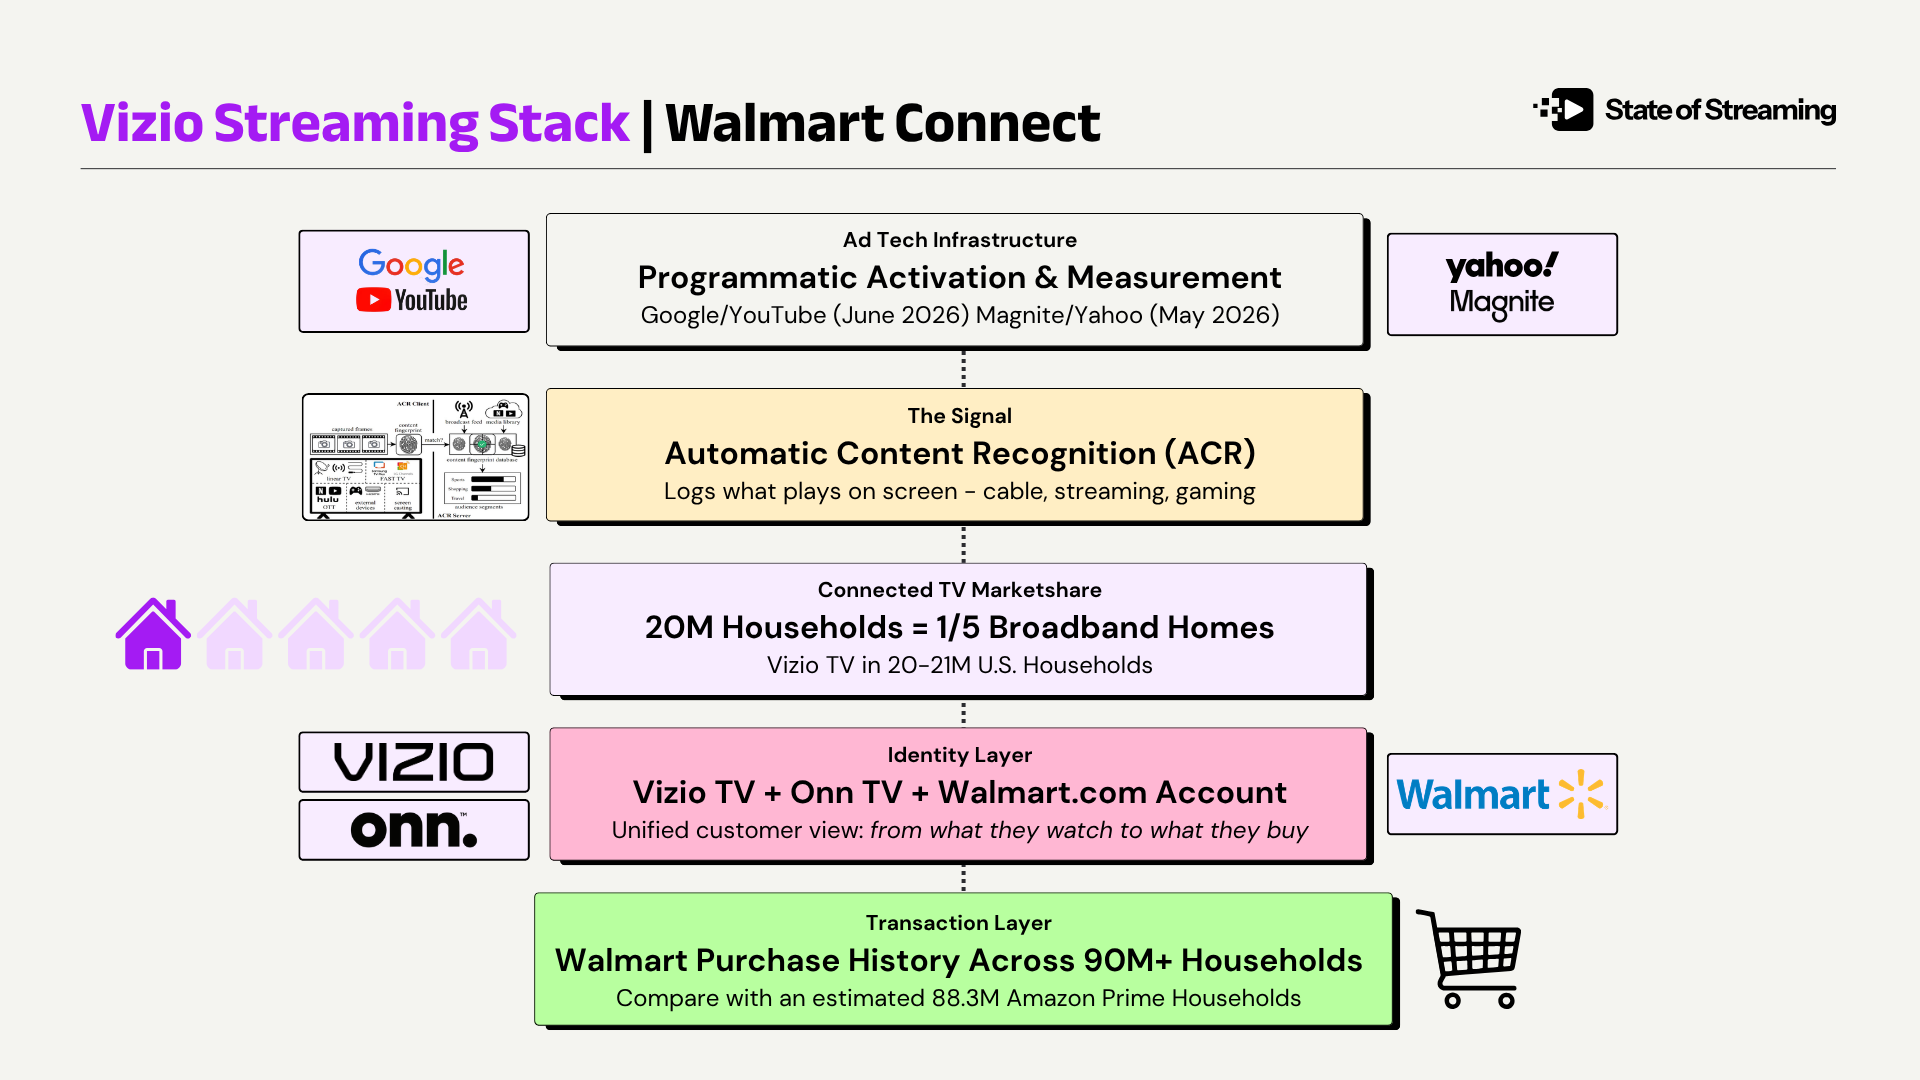
Theme 3: The Convergence of CTV Real Estate and Retail Data
The Connected TV (CTV) is no longer just a digital version of traditional linear television; it is quickly shifting into a performance marketing vehicle with a predictable and increasingly quantifiable user journey. The June index highlights an aggressive trend where hardware distribution is becoming an arms race to capture first-party retail data.
This convergence is playing out across two major lanes:
The Walmart-Vizio Synergy: With Walmart’s ownership of Vizio (#12), home-screen media placements and WatchFree+ inventory are directly integrated with Walmart Connect’s massive first-party shopper data.
The Amazon Ecosystem: Amazon (#2) remains the only player deeply embedded across all three index pillars (Home Screen, Live Sports via Nascar, the NBA, Thursday Night Football, and addressability), allowing them to close the loop from an ad exposure directly to a retail purchase (on and off platform).
June 2026 USPI Performance Matrix
To help visualize how these themes dictate market positioning, the scorecard below maps out how each player balances the crucial trade-offs between distribution control, inventory access, and pricing power.
June USPI
| Rank | Company | Rationale | Home Screen rank | Live Sports Rank | CPM |
|---|---|---|---|---|---|
| 1 | Roku clinches the top spot because it controls the physical and virtual gateway to television, making it an essential purchase during the densest live-sports month on record. Because every major streaming service must launch through its interface, advertisers win by capturing massive, high-intent audiences at the absolute point of discovery before they ever click into a specific app. | 1 | — | $ | |
| 2 |  | Amazon offers an unmatched, full-funnel ecosystem by holding elite positioning across the operating system, premium addressable app inventory, and owned live-sports rights. Advertisers benefit from direct access to premium, non-wrapper live sports inventory combined with closed-loop attribution driven by Amazon's massive retail data footprint. | 4 | — | $$ |
| 3 | Peacock leverages its ownership of premium live sports and Spanish-language World Cup broadcast rights to dominate engagement without relying on third-party aggregators. For advertisers, this means high-momentum, premium ad availability tied to massive cultural events where the broadcaster controls both the feed and 100% of the ad inventory. | — | 5 | $$$ | |
| 4 | Following the consolidation of Hulu and the active tiling of ESPN across its platform, Disney+ has transformed into a scaled, multi-genre powerhouse. Advertisers gain a highly streamlined, massive footprint that merges top-tier entertainment with live sports, effectively capturing cross-demographic audiences on a single surface. | — | — | $$$$ | |
| 5 | As the absolute leader in live sports momentum with the NBA Finals and Stanley Cup Final, ESPN remains the gold standard for high-impact, live-reach environments. Advertisers pay a premium CPM here because they are buying owned, non-wrapper inventory during the highest-rated television broadcasts of the season. | — | 1 | $$$$ | |
| 6 | By absorbing Pluto TV, Paramount+ has successfully paired a premium, hit-driven SVOD catalog with a highly accessible FAST "front porch." This creates a balanced, scaled environment for advertisers looking for both prestige placements and continuous, addressable mass reach. | — | — | $$$$ | |
| 7 |  | While HBO Max remains an elite destination for high-CPM prestige content and targeted addressable ads, its loss of the NBA broadcasting rights severely cripples its live sports momentum. Advertisers should look here for high-quality, culturally relevant entertainment environments, but look elsewhere for real-time sports scale. | — | — | $$$$ |
| 8 | Netflix maintains massive scale and commands top-tier CPMs, but its complete absence from the current June live sports landscape limits its immediate seasonal urgency. Advertisers should view it as a premier destination for cinematic storytelling, keeping in mind that its blockbuster sports inventory is a back-half story. | — | — | $$$$ | |
| 9 | Tubi is experiencing a major surge by pairing free addressable supply with Fox-owned, non-wrapper World Cup coverage. This presents advertisers with an incredibly cost-effective, high-momentum vehicle to capture massive sports audiences without paying traditional linear premium rates. | — | — | $ | |
| 10 | Running in 46 million ad-supported households, Samsung offers the largest pure OEM home-screen footprint on the market. Advertisers can utilize this layer to buy high-impact native display ads that capture consumer attention the exact second the television screen turns on. | 2 | — | $ | |
| 11 | LG provides a highly scaled operating system footprint that captures over 25 million ad-supported households via its native home screen and LG Channels. It represents a vital, non-fragmented buy for advertisers looking to secure broad, top-of-funnel reach before viewers disappear into ad-free premium tiers. | 3 | — | $ | |
| 12 | Anchored by Walmart ownership, Vizio bridges the gap between home-screen media placements and first-party retail purchase data. This enables advertisers to run highly targeted, closed-loop CTV campaigns where ad exposure can be directly tied to actual register sales. | 5 | — | $ | |
| 13 | Packing the combined distribution muscle of Comcast and Charter, Xumo offers a growing OEM front door with an enterprise-grade ad stack. Advertisers should eye this platform for robust, infrastructure-backed scale that targets cord-cutters right at the hardware level. | — | — | $ | |
| 14 | Google bypasses the expense of manufacturing proprietary TV sets by aggressively embedding its OS into high-volume retail movers like TCL and Hisense, while anchoring store shelves with its own premium Google TV Streamer and Walmart's ultra-affordable, white-label onn. devices. This dual-lane retail strategy inserts Google's ad-supported interface directly into both premium tech households and value-driven mass markets at the point of purchase. | — | — | $ | |
| 15 | Despite drawing massive sports audiences for the World Cup and Sunday Ticket, YouTube TV operates as a wrapper that passes the vast majority of its ad inventory back to the networks. Advertisers must understand that while its reach is massive, sellable ad availability is structurally limited to local and dynamic avails. | — | 3 | $$$$$ | |
| 16 | Fubo is actively trying to break through the wrapper ceiling by migrating its ad inventory directly onto the Disney Ad Server stack. This allows advertisers to buy a hyper-concentrated, highly loyal sports audience at a premium rate, pitched seamlessly alongside legacy giants like ESPN and Hulu. | — | 4 | $$$$ | |
| 17 | Crunchyroll bypasses mass-scale metrics to deliver an incredibly loyal, hyper-engaged anime audience with unmatched community stickiness. Advertisers looking for cultural relevance over raw numbers can tap into an elite, hard-to-reach demographic that cannot be easily replicated on broad streaming platforms. | — | — | $$$ | |
| 18 | As a brand-new, direct-to-consumer destination launching straight into the World Cup, Fox One holds high live-sports momentum but lacks foundational scale. Because Fox owns the feed, advertisers get clean access to premium inventory, though they must pair it with other platforms to achieve meaningful reach. | — | 2 | $$$$ | |
| 19 | Philo operates as a low-cost, entertainment-focused skinny bundle with minimal sports presence and very little sellable ad inventory. It matters to advertisers primarily as a niche, highly stable budget wrapper for reaching specific cord-cutting lifestyle demographics. | — | — | $$$ | |
| 20 | Sitting at the bottom of the board, DirecTV Stream represents the inherent risk of the wrapper model after suffering catastrophic mid-series blackouts during the Stanley Cup Final. Advertisers should approach with extreme caution, as severe carriage disputes directly threaten live-ad delivery during critical cultural moments. | — | — | $$ |
To see how leading executives evaluate this shifting balance of power, access the full Looper Insights Research Hub on Sports Streaming Architecture.
Get the SOS. Brief
The sharpest streaming intelligence, delivered to your inbox.