The Device Home Screen Is the Battlefield: August 2026 Unified Streaming Power Index
There is a finite universe of streaming attention: 101,582,619 U.S. Broadband Connected Households (per the 2024 census) plus another 16,722,836 connected via cellular data with no other internet subscription, bringing the estimated 132,737,146 U.S. households down to an internet addressable universe of 117,696,246 or 88.6% of the country.
Our August USPI looks most critically at the 101,582,619 Broadband Connected Households in four areas:
Devices: Our August USPI deep dive pillar. We look at the role of the gaming console in the connected household, how Roku's merchandising of the WNBA has influenced record viewership, and a local automotive case study on the power of the Fire TV home screen.
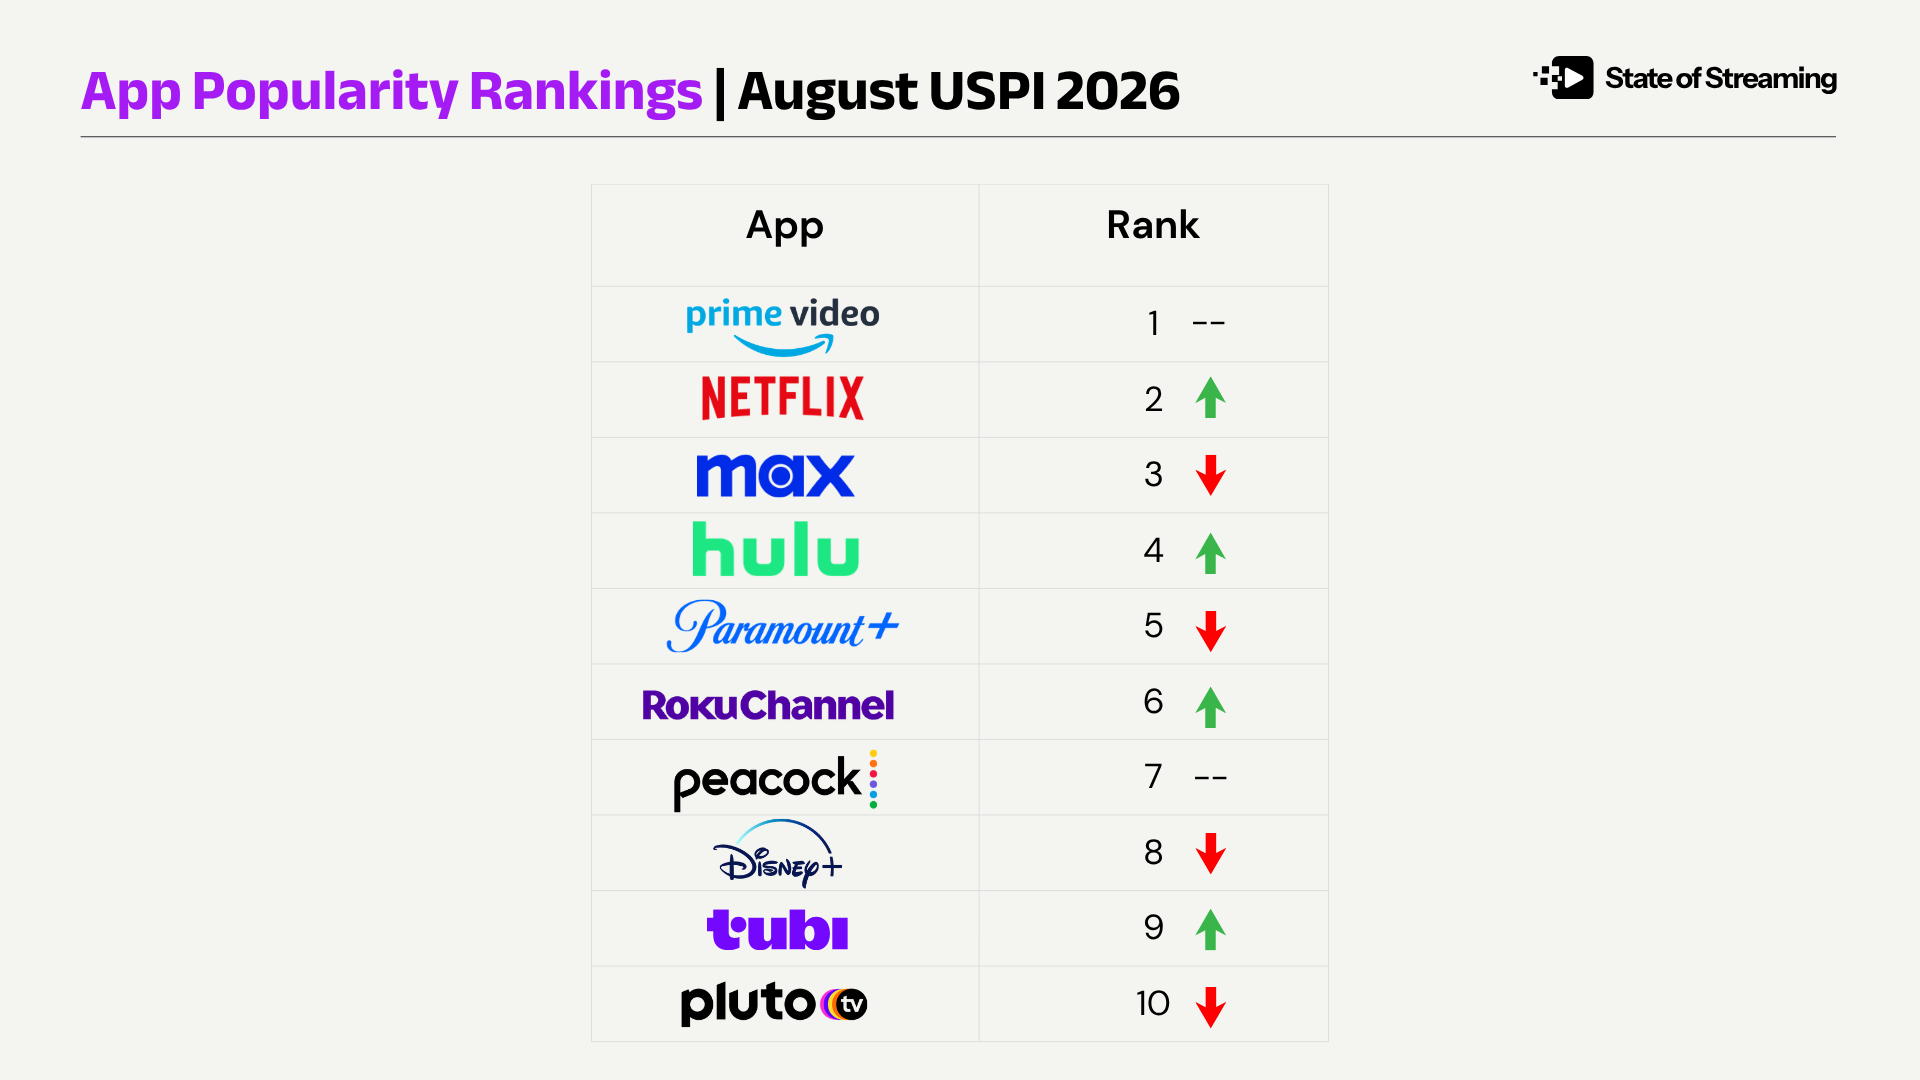
App Popularity: A new vector for the USPI. Find out which apps are commanding the most attention. Did you know? According to MRI-Simmons, the average streaming household switches between 11 apps over 12 months. This section tracks which are trending up and which are trending down.
Live Sports: You've seen the stat "96 of the top 100 most-watched events of 2025 were sporting events." This section looks at who is really winning the battle for sports streaming attention.
Ad Tech Trends: This month we introduce three trends that stood out from all of our analysis and coverage so far this summer. In the coming months we will continue to build our Ad Tech USPI.
Would you like to contribute to a future issue of our Unified Streaming Power Index? Email tim@stateofstreaming.com
In A Meme
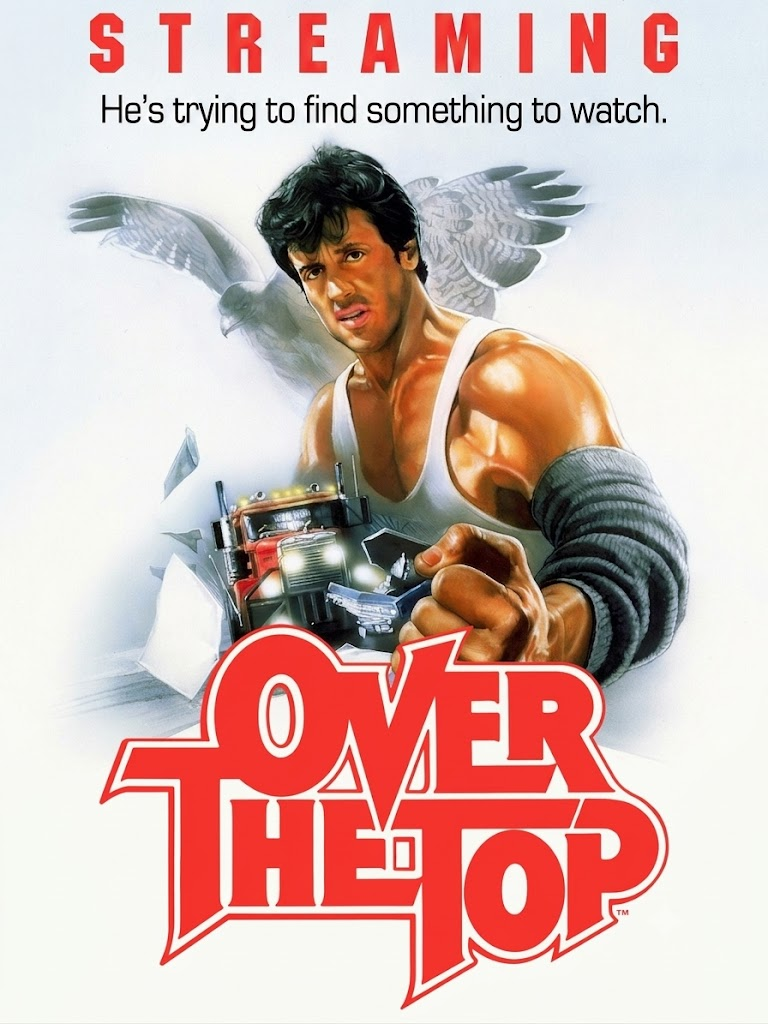
In a quest to find something to watch this past weekend, my son and I opted for the Sly Stallone classic 'Over The Top'. The classic featuring Stallone's character, Lincoln Hawk, a long-haul truck driver who tries to win back his estranged son Michael while becoming a champion arm wrestler. Something we can all relate to, really.
How do you stream?
And why the connected device matters more than ever.
When you turn on your TV, what's the first thing you see? That's the role of the connected television (CTV) home screen. It's the first impression. The port of entry. A friendly greeting after a long day.
And where the debate about "minutes watched" ends, a new conversation begins: who owns the streaming journey?
The Unified Streaming Power Index was built to answer that question. This August 2026 installment looks critically at the role of the home screen — and at which streaming apps rank highest with consumers for their current content portfolios, the impact of live sports viewership, and ad tech interoperability.
This month's index also goes beyond the typical CTV manufacturers. It introduces console television — and the role gaming systems play in the streaming journey.
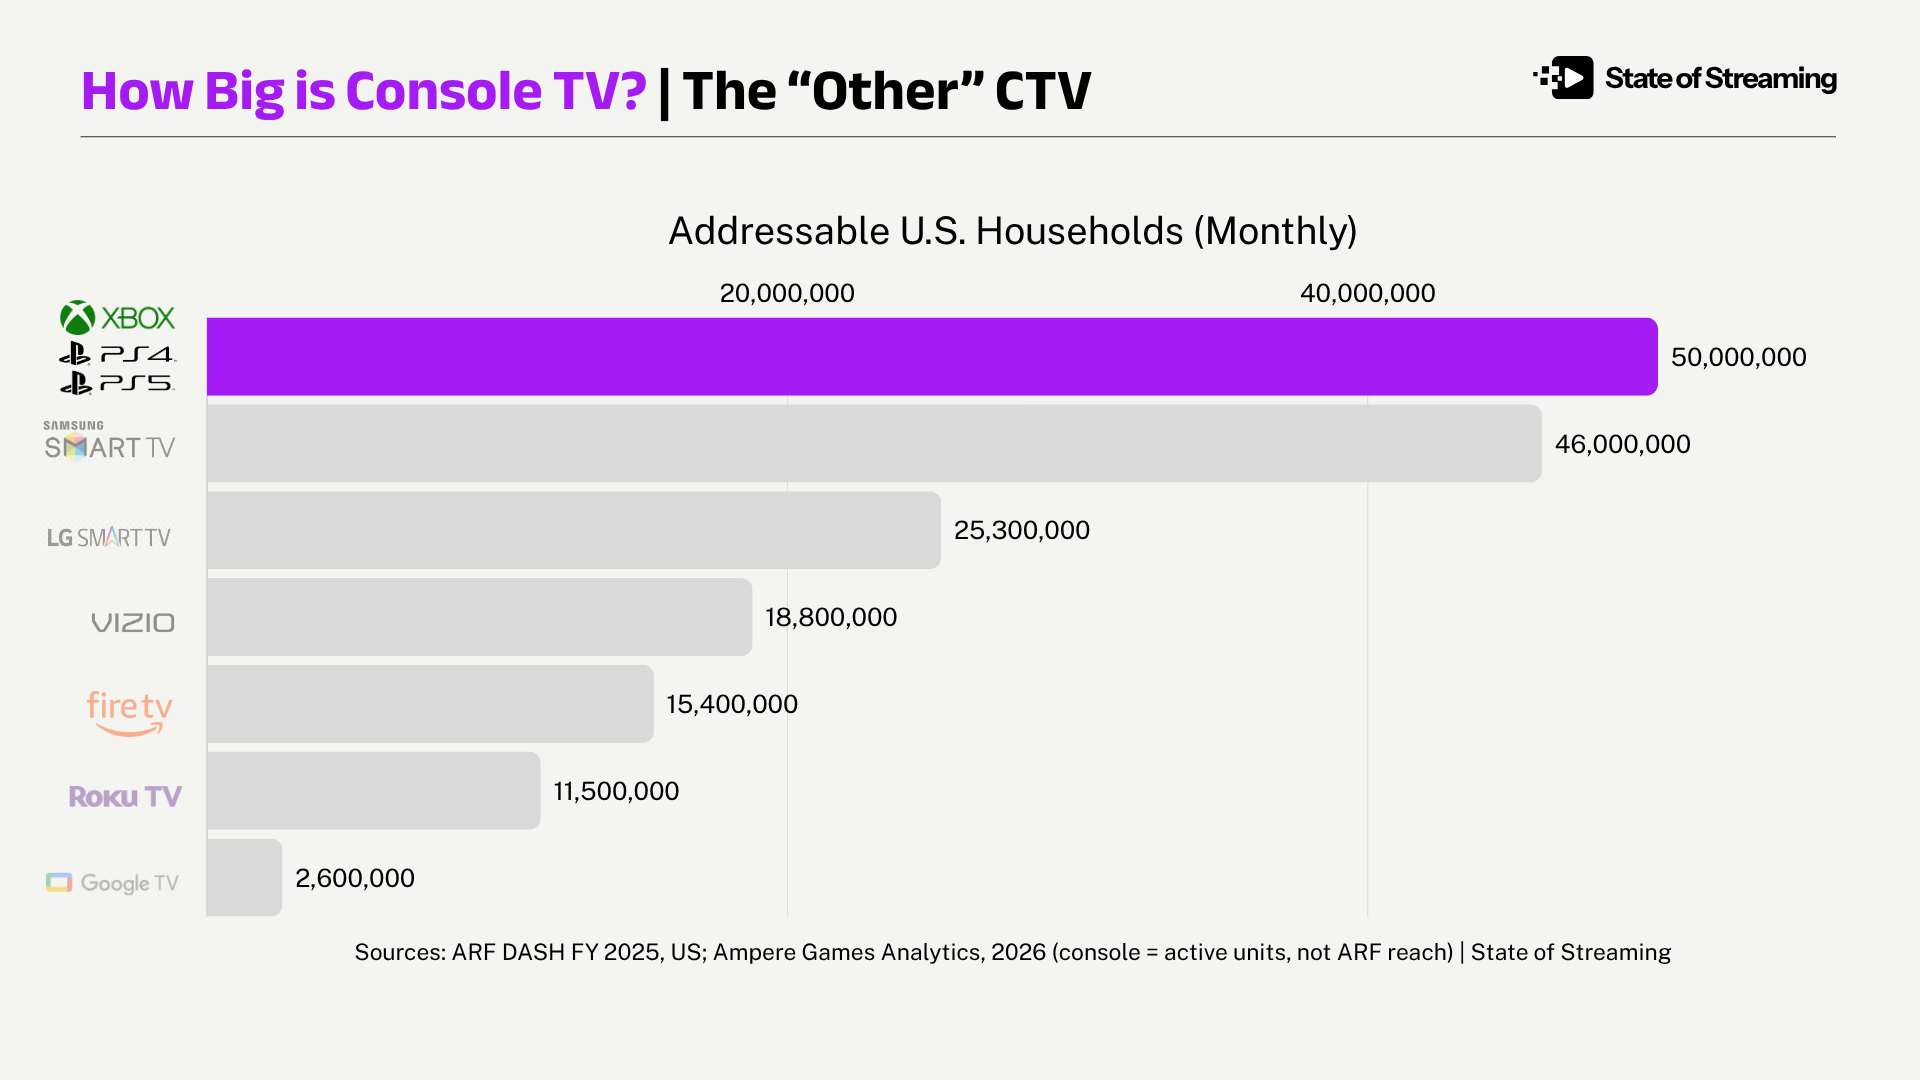
Xbox's Six-Month Rollout: From Leaked Pop-Up to Live Product
January 17-20, 2026 — The Leak Back in January, Xbox Cloud Gaming users started noticing a load-screen message that shouldn't have existed yet, referencing capped, ad-supported playtime. Reporting quickly confirmed what the error gave away: a free, ad-supported tier, separate from Game Pass, that will let players stream games they already owned without a subscription. Paying subscribers would stay ad-free. Everyone else would trade limited monthly playtime for ads.
June 25, 2026 — Microsoft Confirms It Five months later Microsoft opened the free, ad-supported tier to Xbox Insiders as the official test tier, capped at one hour a session, roughly five hours a month, with ads running before each stream.
July 30, 2026 — The Second Front Goes Live Five weeks after the Insider test opened, Xbox announced the Xbox app running on VIDAA OS-powered Hisense smart TVs, rolling out over the prior month to millions of sets from 2024–2026 model years. No console required. No PC required. Just the TV you already own, an Xbox Game Pass subscription, a Bluetooth controller, and you’re streaming Forza Horizon 6 or Halo: Campaign Evolved straight to the living room.
Why It Matters
Global Scale
Hisense held the No. 2 global TV shipment spot in 2024 at 14% share (Omdia), its third straight year there. By early 2026 Hisense fell to third place overall, overtaken by TCL, with shipments down 13% year-on-year as its China business contracted. TCL and Hisense combined now hold 25% of global share by revenue, surpassing Samsung and LG's combined 24% for the second year running. Samsung still leads outright at 29.1% revenue share, but the gap with China has narrowed from 33.2% in 2021 to 20.1% last year.
The Aggregator Paradox Thesis
The streaming economy is splitting into landlords who own space and tenants who rent that space. The reason Fox is prepared to shell out $22,000,000,000 for Roku’s playbook is because it is playing both roles at the same time.
Xbox is attempting its own version of that duality. To unlock maximum value for themselves and their users, Microsoft will have to get serious about it’s most valuable asset — the console television home screen.
Roku and the WNBA
What does ‘Winning the Home Screen’ look like?
WNBA Case Study: Record Viewership
Roku Sports Zone Analysis — The Opportunity Roku built four women's-centric Sports Zones in 14 months — National Women’s Soccer League (Mar '25), multi-sport Women's Sports Zone (Mar '26), the men’s and women’s NCAA March Madness Zone, and the WNBA Zone (May '26). Joe Franzetta, Head of Sports Media at Roku architected all four with zero rights spend. One focus: make it easier to find the game.
Why Advertisers and Consumers Love It
82% of streaming users want you to ‘read their mind’ (Roku Internal Data)
56% of Roku Streamers want a centralized location to access all their sports content (Roku Internal Data)
40% of streaming users are overwhelmed by choice (MRI-Simmons)
Streaming users rotate an average of 11 different apps per year (MRI-Simmons)
Roku Sports Zone Analysis — The Exposure Via our partnership with Looper Insights, we compared the estimated Dollar Media Placement Value ($MPV) the WNBA received from Roku to the other leading connected TV home screens and here’s what we found:
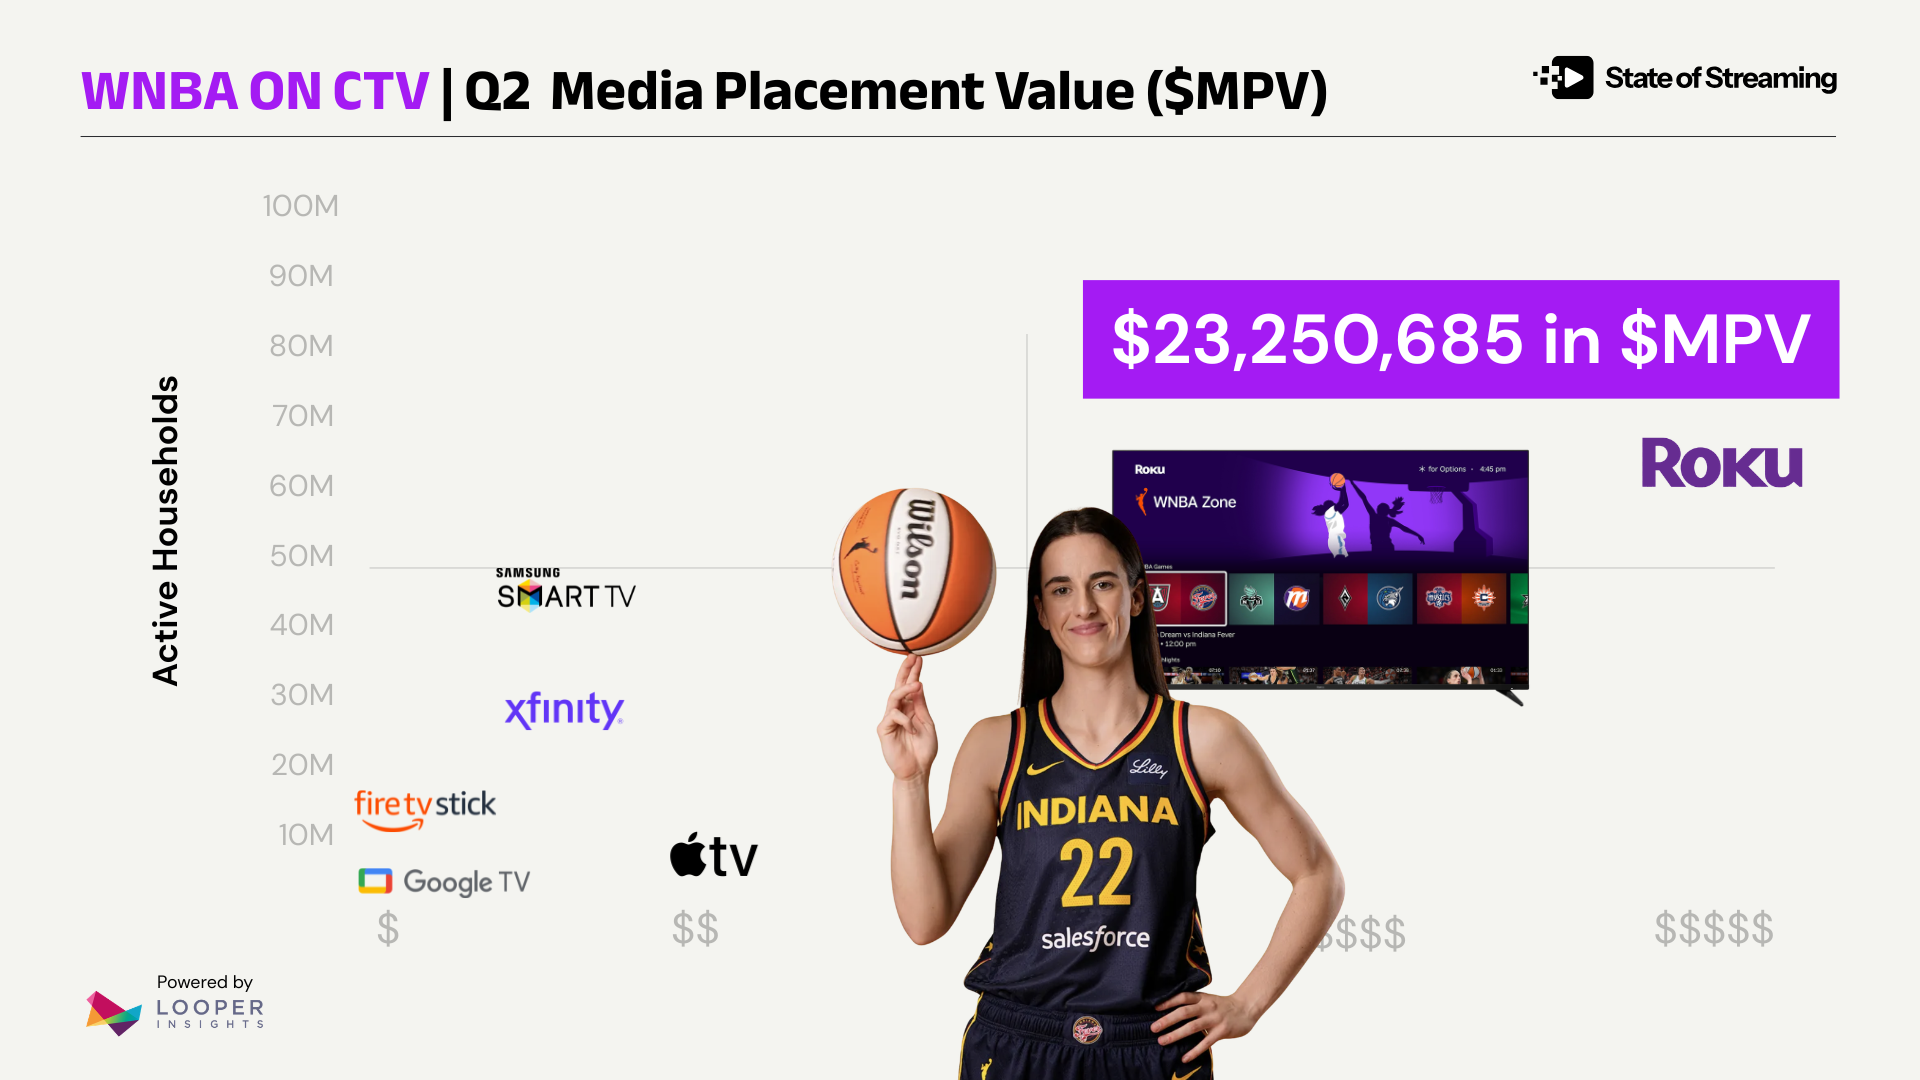
WNBA Q2 $MPV by platform:
Roku: $23,250,685 (95.4%)
Apple TV: $513,715 (2.1%)
Xfinity: $297,184 (1.2%)
Samsung TV (2022): $170,906 (0.7%)
Fire TV: $76,660 (0.3%)
Samsung TV (2020): $52,526 (0.2%)
Google TV: $18,496 (0.1%)
Total: $24,380,172
What $MPV Is
A dollar estimate of home-screen/hub placement value — hero tiles, row position, the streaming shelf space.
Built from (Share-of-voice × CPM-style rate cards) × Device Volume.
A proxy for exposure the same way a billboard is priced based on traffic and location.
What $MPV Isn’t
Ad revenue actually sold or booked.
A measure of viewership or ratings. (Download the Q2 Looper Insights report here)
Roku Sports Zone Analysis — The Outcome Roku launched the WNBA Zone in May 2026. Four months later, the league just posted 73M unique viewers through the All Star break — already beating all of last season's total (63M unique viewers). As of publication, there have been 29 games with over 1M viewers versus 11 in all of 2025.
Our stance is that the sequence is the finding. That merchandising preceded viewership. Not that it is the sole contributor, but that the two are inextricably linked.
The Result Merchandising investment and viewership growth move together on a timeline where the platform's bet came first. Look for the platforms building dedicated hubs ahead of a ratings case. This means there are market makers like Prime Video, Apple TV, and YouTube who could capture entire audience segments via intentional sports curation plays. The same logic applies for console television.
Download the Q2 Research from Looper Insights here.
Amazon Fire TV: Feature Rotator
Local Automotive — Case Study
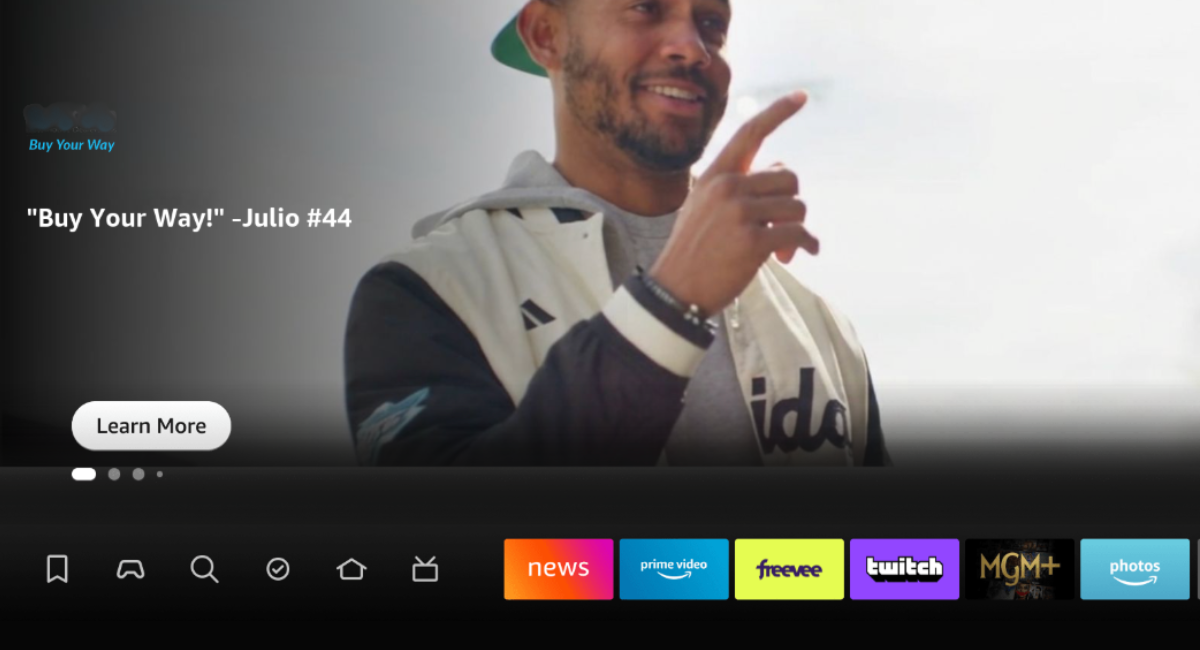
We work with a number of ad tech companies, data aggregators, advertising agencies, and infrastructure partners to create a comprehensive perspective of which dynamics matter most to advertisers. This month’s case study comes to us from Clover Agency and shows how a home screen ad type from Amazon’s Fire TV — the Feature Rotator, is being used by local automotive dealers to drive sales and service visits.
How the Feature Rotator works
Fire TV's Feature Rotator gives local advertisers the same home-screen presence national brands get — full-screen, sound-on video, first thing viewers see as the top placement on the Fire TV home screen but with local targeting and budget flexibility. When a user loads the home screen, the Feature Rotators goes live and after a brief pause it auto-expands to full-screen video (5-18s) with sound, then rotates through a carousel of other spots.
(Image courtesy of Clover Agency)
What Clover Agency found
Clover Agency works primarily with local retail and service industry advertisers, specifically serving a large segment of automotive dealers. Our analysis compared their portfolio of results for this ad type, creative strategies, targeting, and ultimately ad exposed outcomes. Two distinct themes emerged: superstar credibility and native-language creative.
Superstar Credibility
One of the dealers leveraged their partnership with an MLB superstar in their creative as a layer to their media mix. In July, the Feature Rotator placement delivered 116,565 impressions during July with 470 on-site actions observed from the exposed audience at a cost-per-action of $2.35.
Spanish-language Targeting
According to TV outcomes reporting from EDO, ads on Spanish-language networks have proven to be 31% more effective than those on English-language TV industry-wide. The Clover Agency portfolio benchmarks showed cost-per-action at $5.07 in Spanish versus $7.27 in English, reflecting an efficiency gain of exactly 30.2%.
Key Finding: On a dollar-for-dollar basis, Spanish creative delivered 43% more site visitation from the Fire TV Feature Rotator.
Final August Rankings
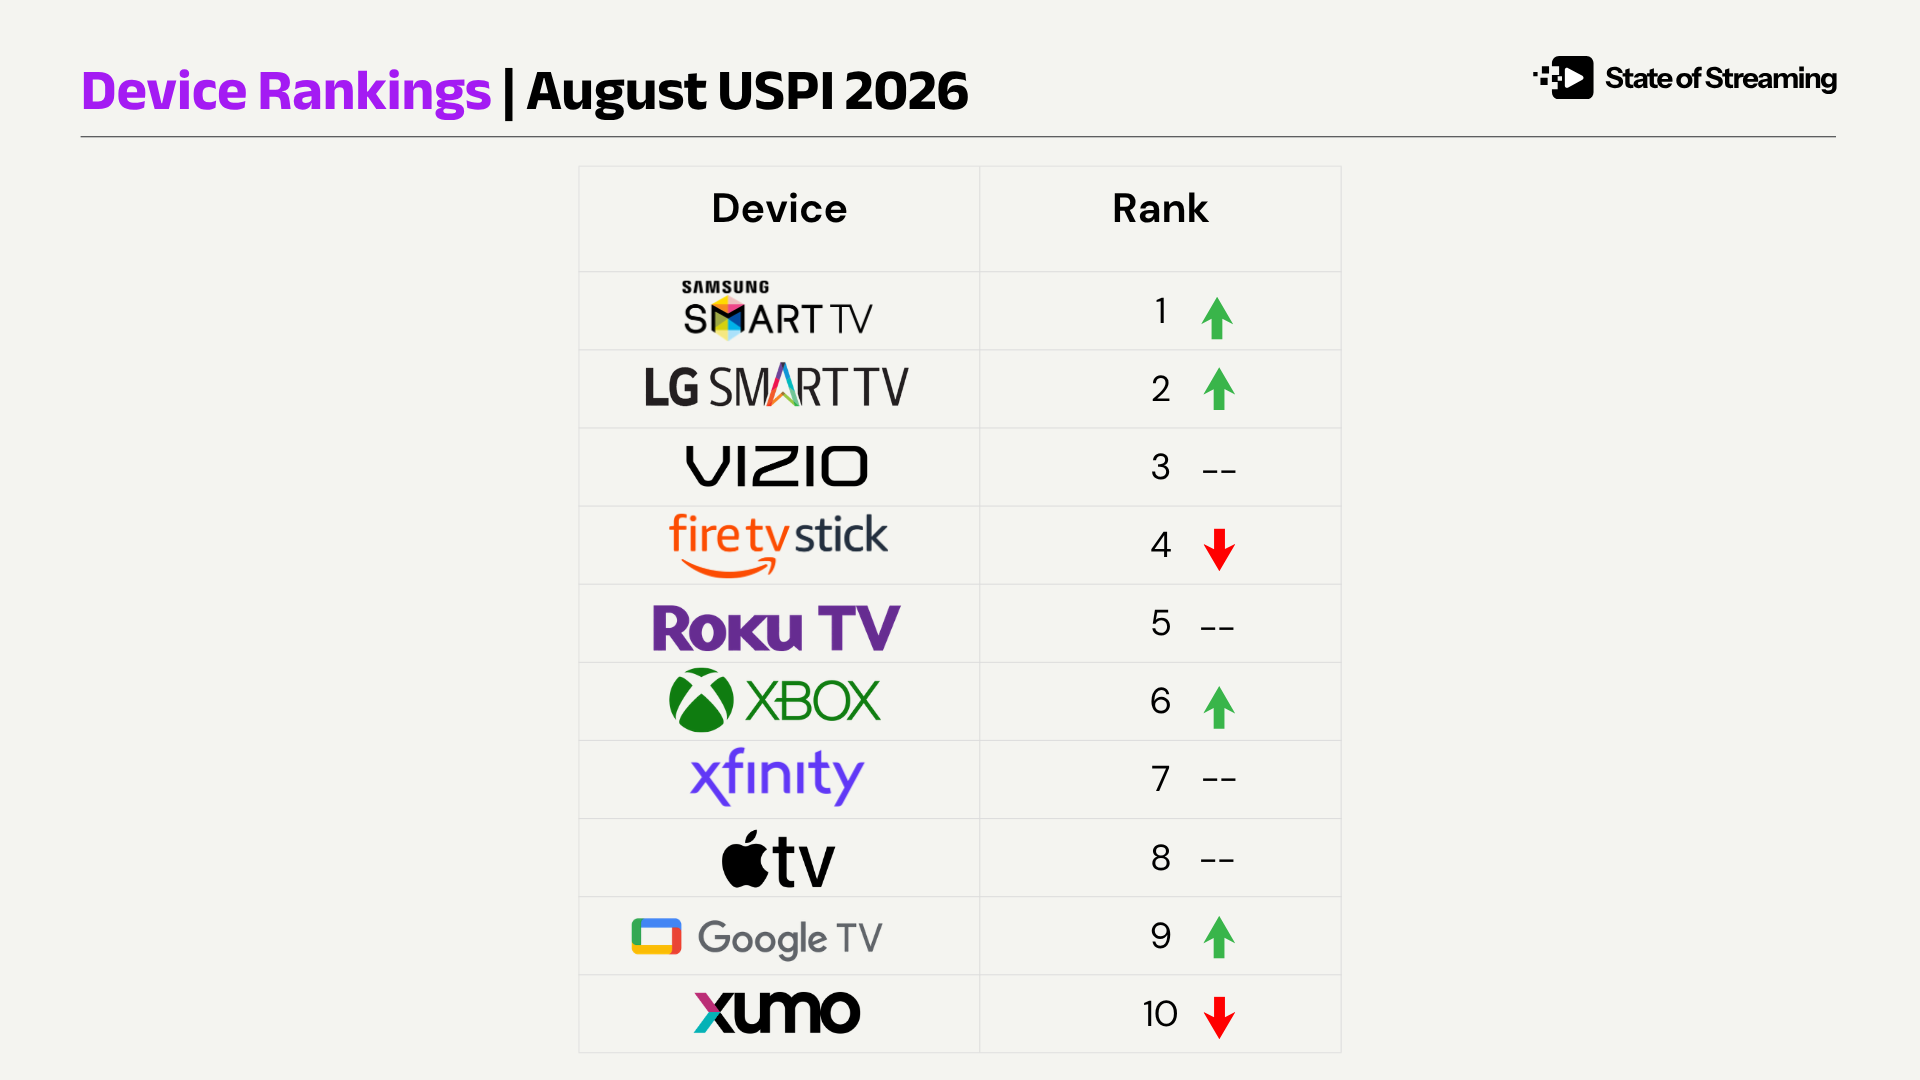
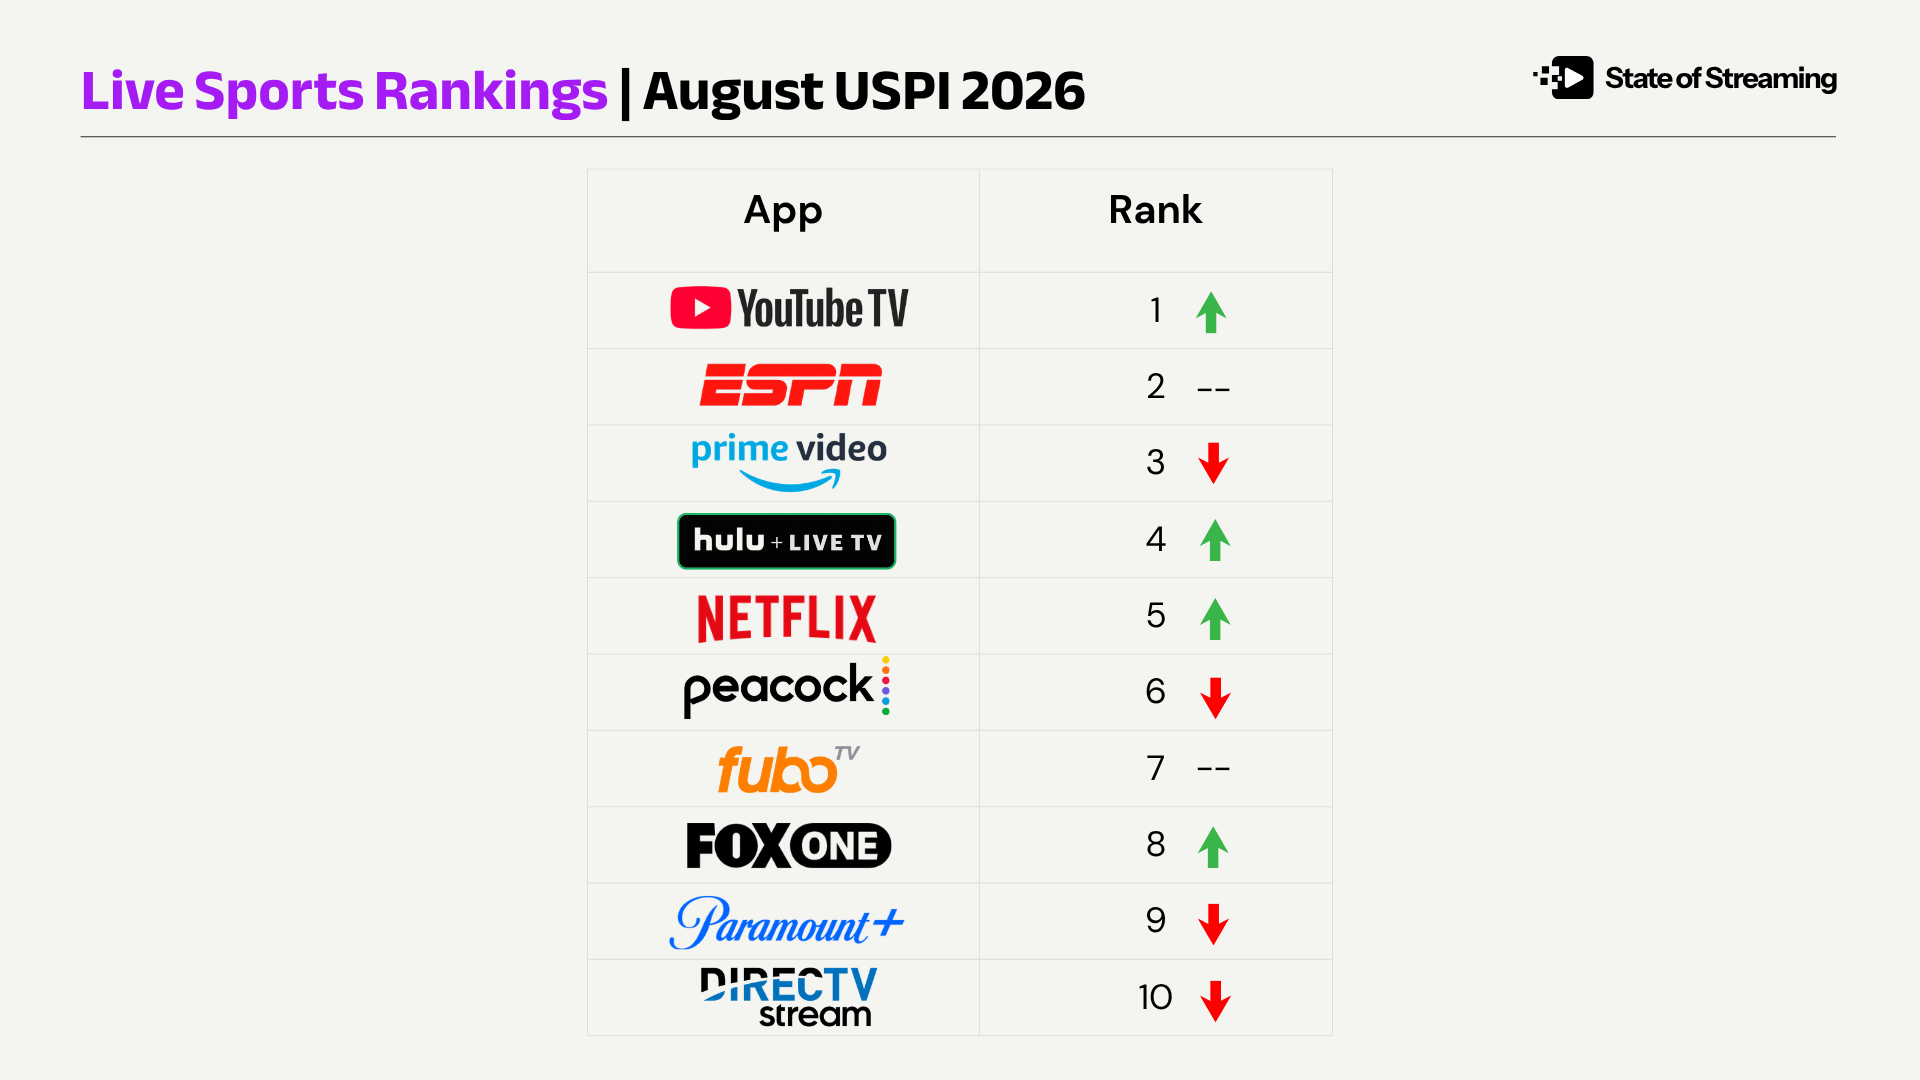
Our August USPI rankings take into account the active monthly households connected to streaming via these devices, known engagement metrics, and a directional application of that understanding to create a clear ranking of connected devices by their addressable impact.

June-July: Looking backward
Nobody is loyal to an app
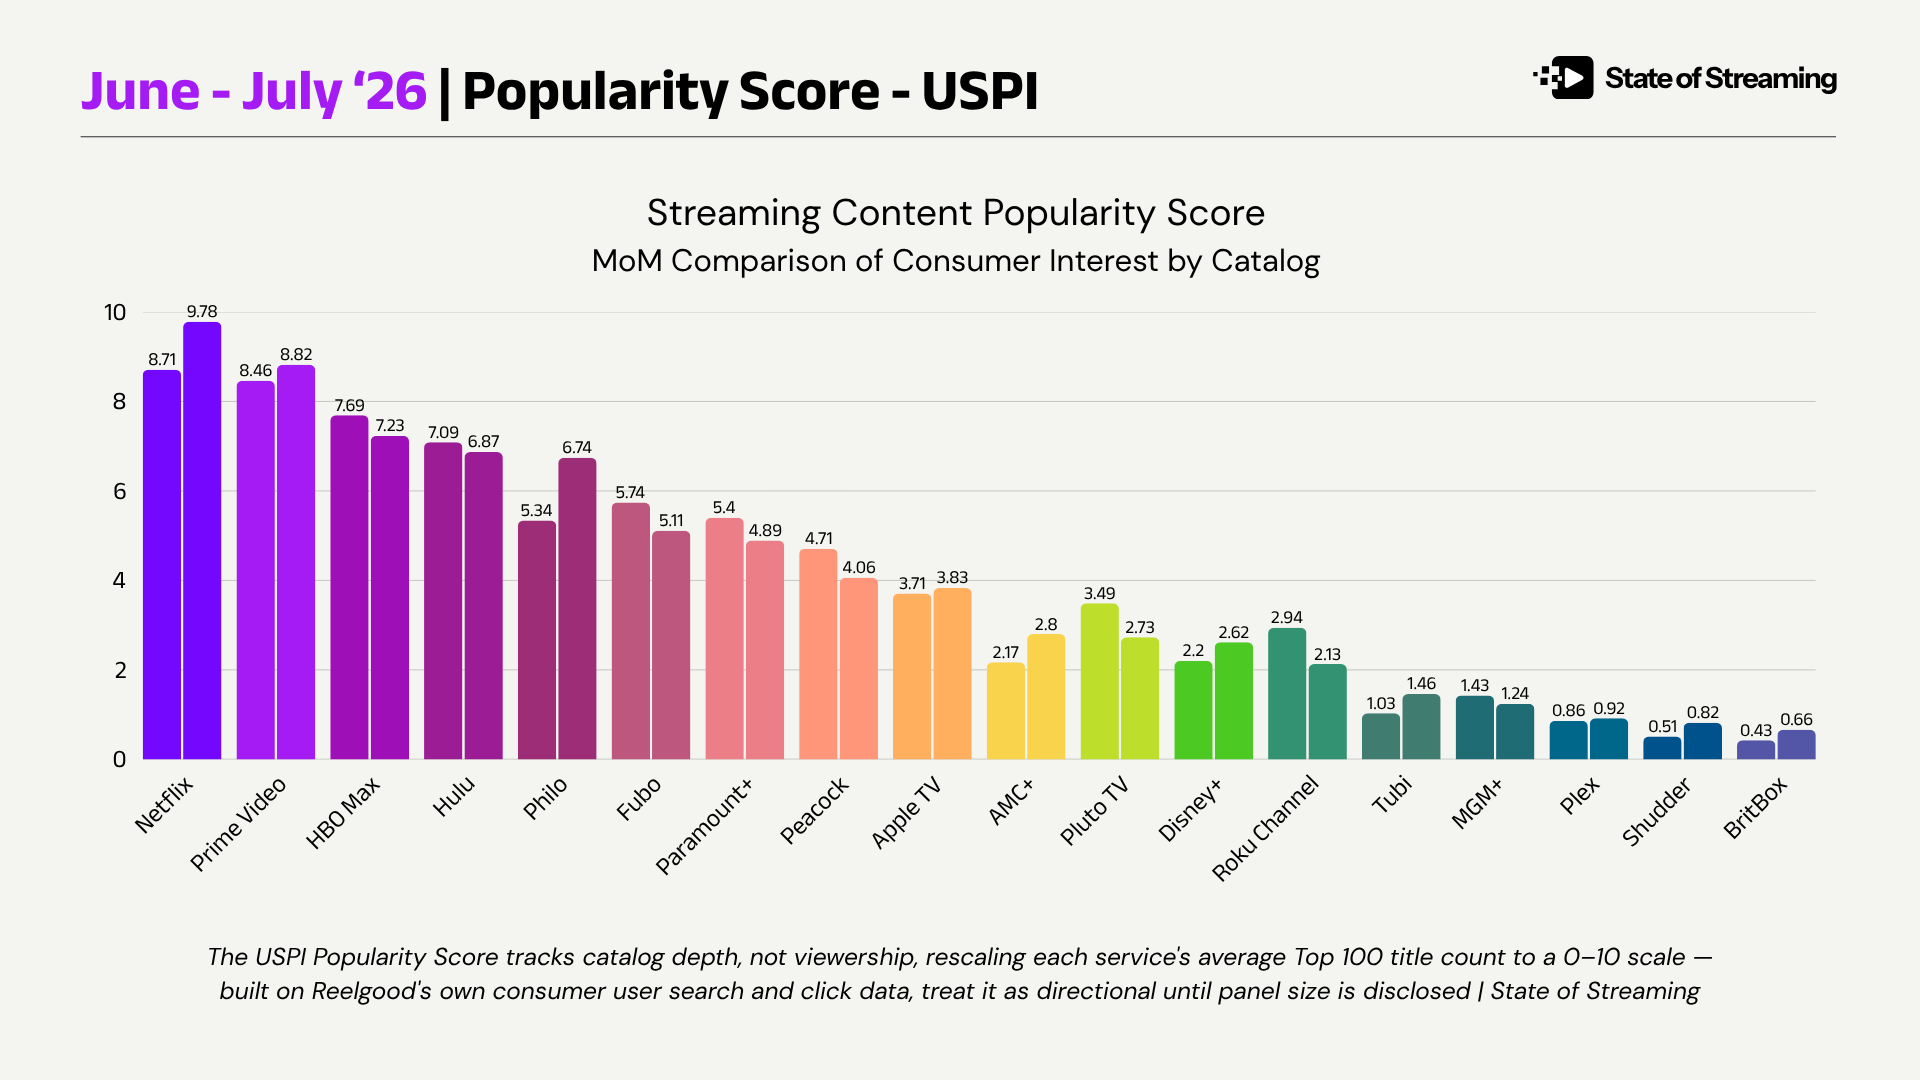
The average streaming household switches between 11 different apps over the course of a year, per MRI-Simmons. The USPI's Popularity Score measures how much a service's content shows up in the national Top 100 over a month. The goal being to understand which apps are commanding the most attention and thus worthy of your advertising investment.
What we found
Working with our partners at Reelgood, we analyzed how much people are actively searching for and watching what's on each app right now and what we found confirmed one thesis and introduced another.
Philo and Fubo are essentially cable-in-an-app: you subscribe, and you get a bundle of channels the same way you would with a cable box. They don't own the content. They're just the pipe. But this month those pipes scored higher than services that spend billions making and licensing original shows and movies. The question is ‘why?’.
The Aggregator Paradox Repeated
Philo is a delivery wrapper around 70+ channels it doesn't actually own — A&E, AMC, Discovery, Hallmark, MTV, Paramount Network, and the like. Fubo runs the same wrapper model as Philo, but with a different value prop as a sports-first offering, built around live rights (RSNs, ESPN, national broadcast) instead of a cable rerun portfolio which is arguably more similar to Roku’s Howdy in composition.
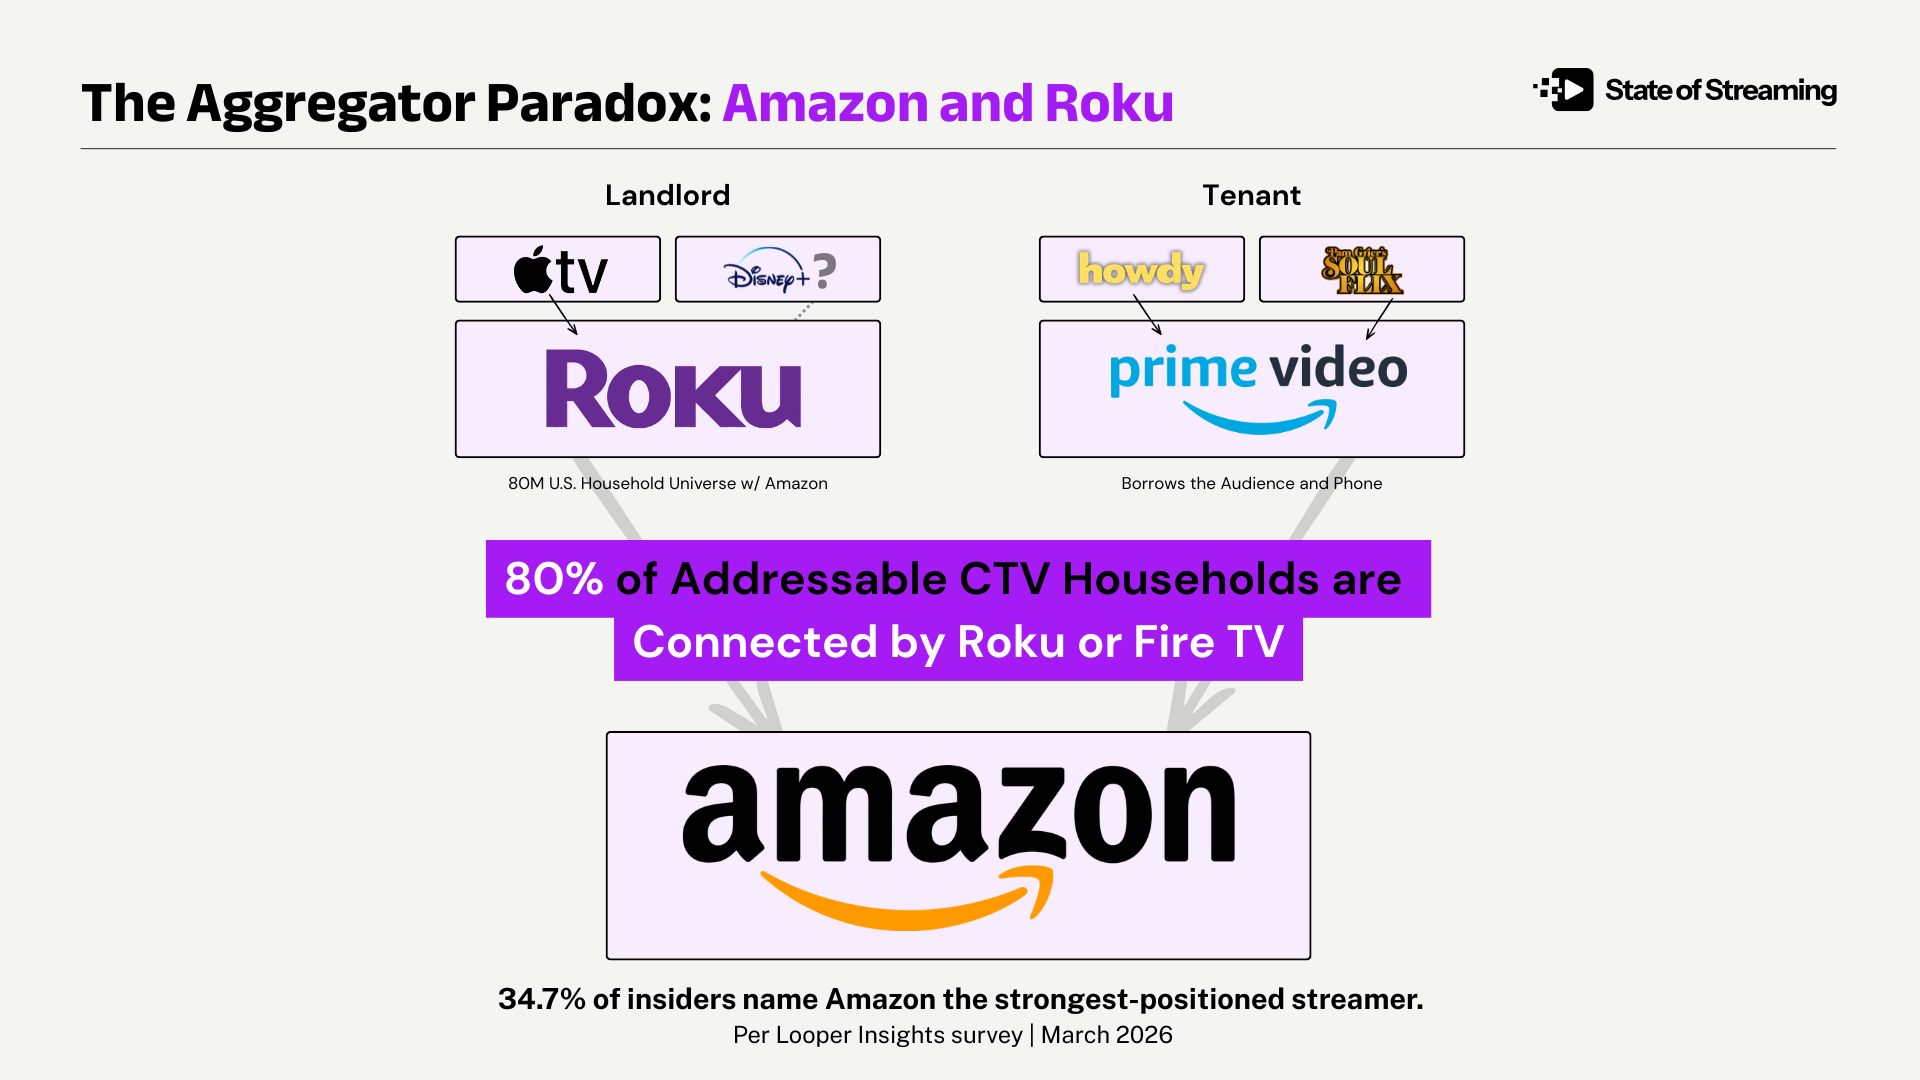
(Read 'The Aggregator Paradox', originally introduced in March of 2026 here.)
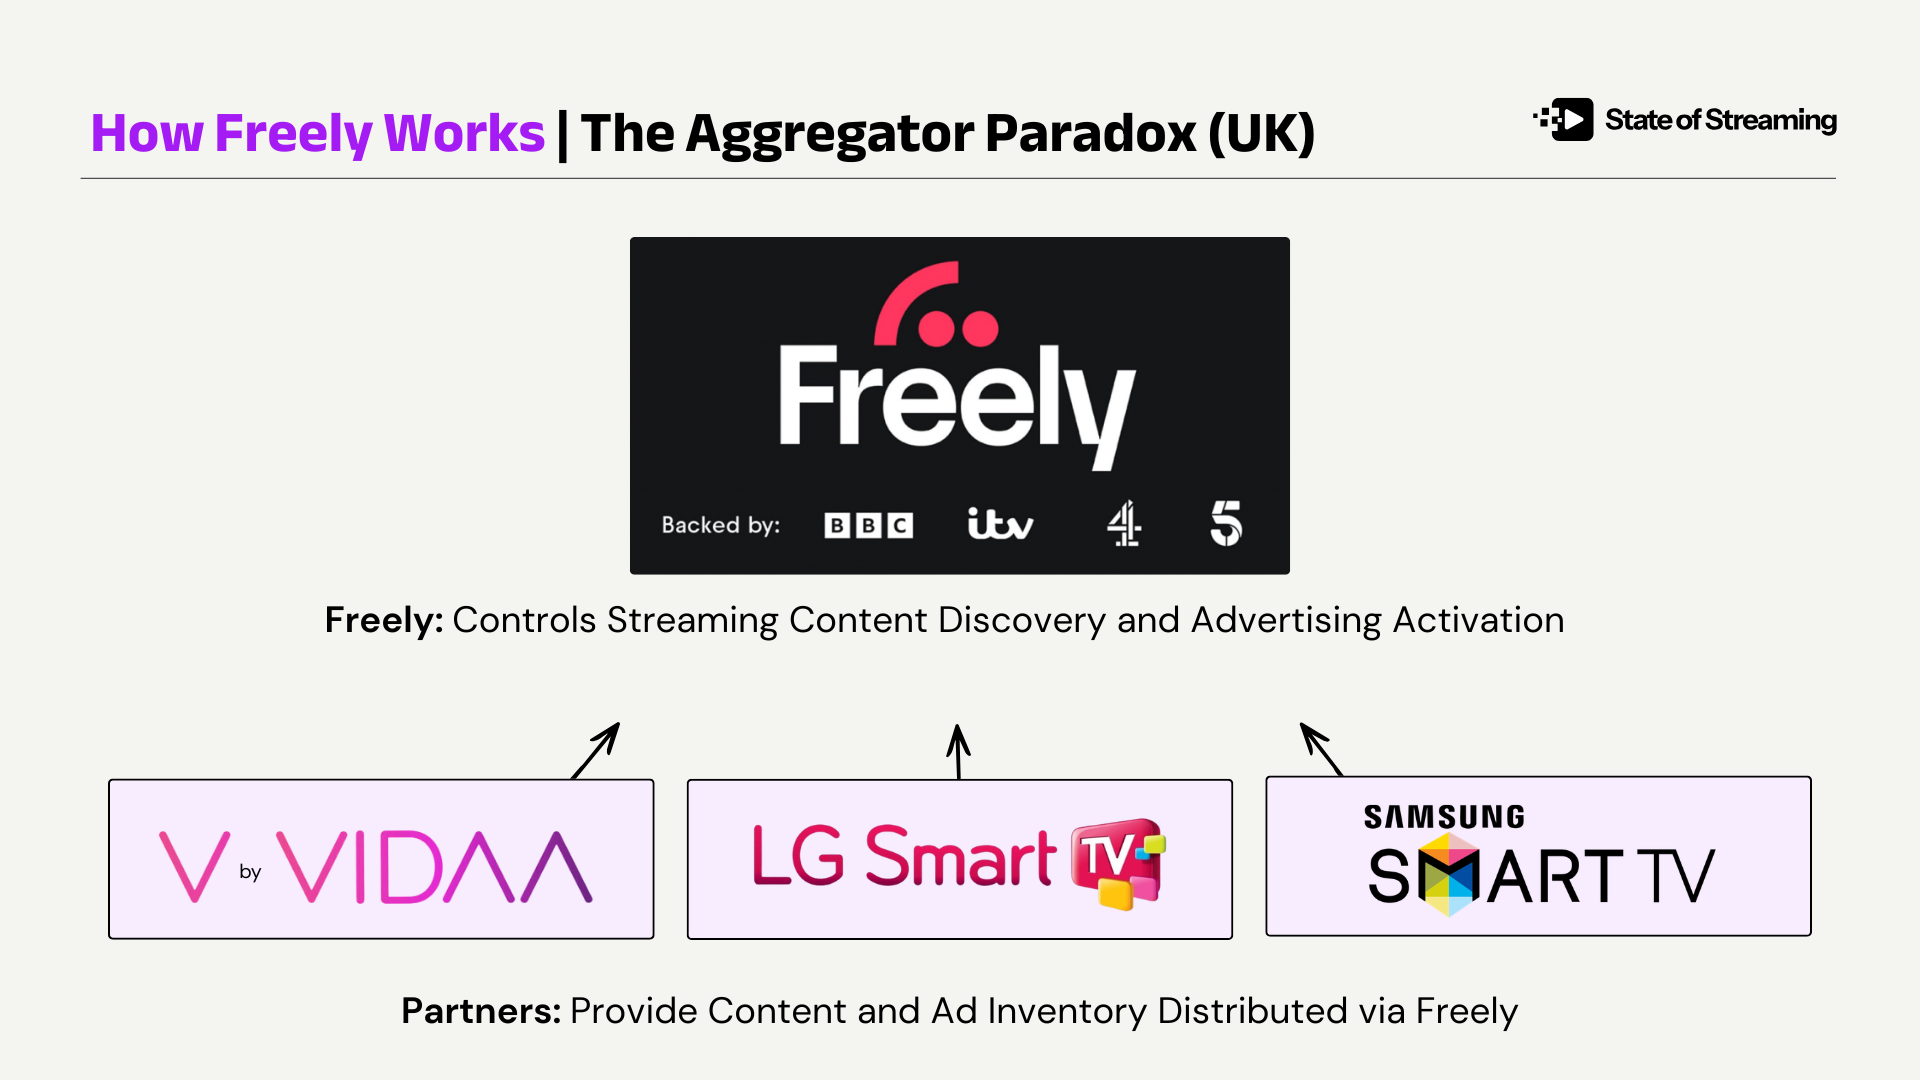
(And read 'The Aggregator Paradox: UK' here.)

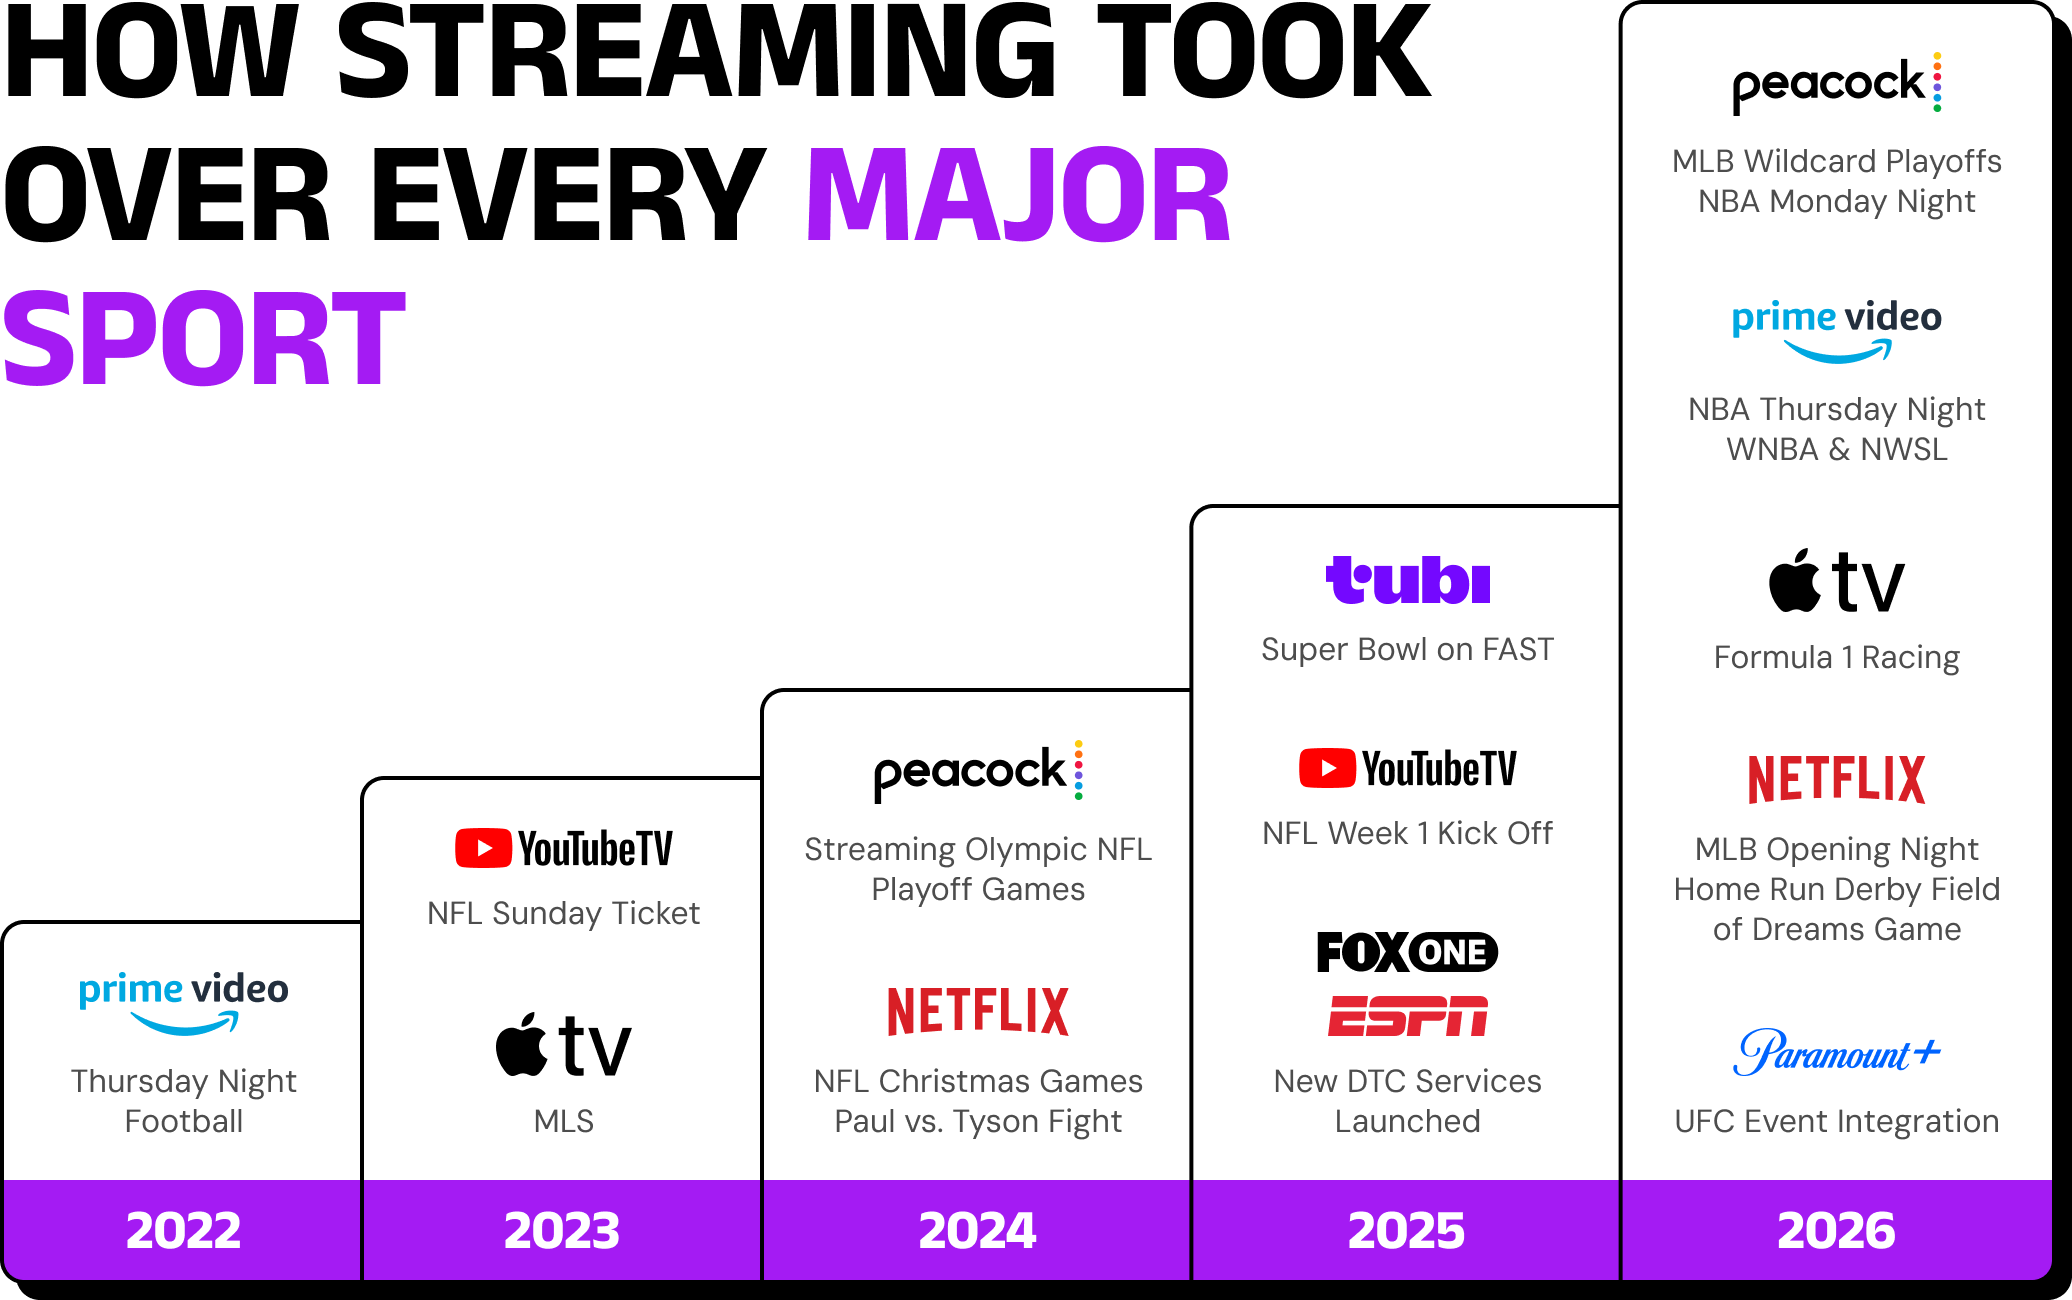
Streaming won the rights but it hasn't won the remote...yet.
How We Got Here
2023: NFL Sunday Ticket to YouTube TV
2024: Olympic and NFL playoff coverage on Peacock
2025: Netflix's Christmas doubleheader and the Paul-Tyson fight, Tubi's Super Bowl on FAST, Fox One's DTC launch
2026: Peacock adds MLB Wild Card, NBA Monday Night, the Winter Olympics, and the Telemundo World Cup simulcast; Prime Video holds NFL and NBA Thursday Night plus WNBA and NWSL; Netflix adds NFL, WWE Raw, and MLB games; Apple TV has F1; Paramount+ has UFC.
The Discoverability Problem Is Now Measurable
Hub Entertainment Research found most sports fans agree it's become a hassle to use multiple services to watch games during a season, and that finding what they want to watch has gotten more confusing. Compounding that confusion is cost.
USA Today put a number on what it actually takes to follow the NFL alone across its current rights holders: as much as $1,500 a year. Multiply that across every league splitting its rights the same way, and it is no wonder 72% of viewers feel like they’re paying “too much for streaming”.
Roku’s own internal data shows that 56% of users “want a centralized location to access all their sports content” making this is a present challenge worth solving.
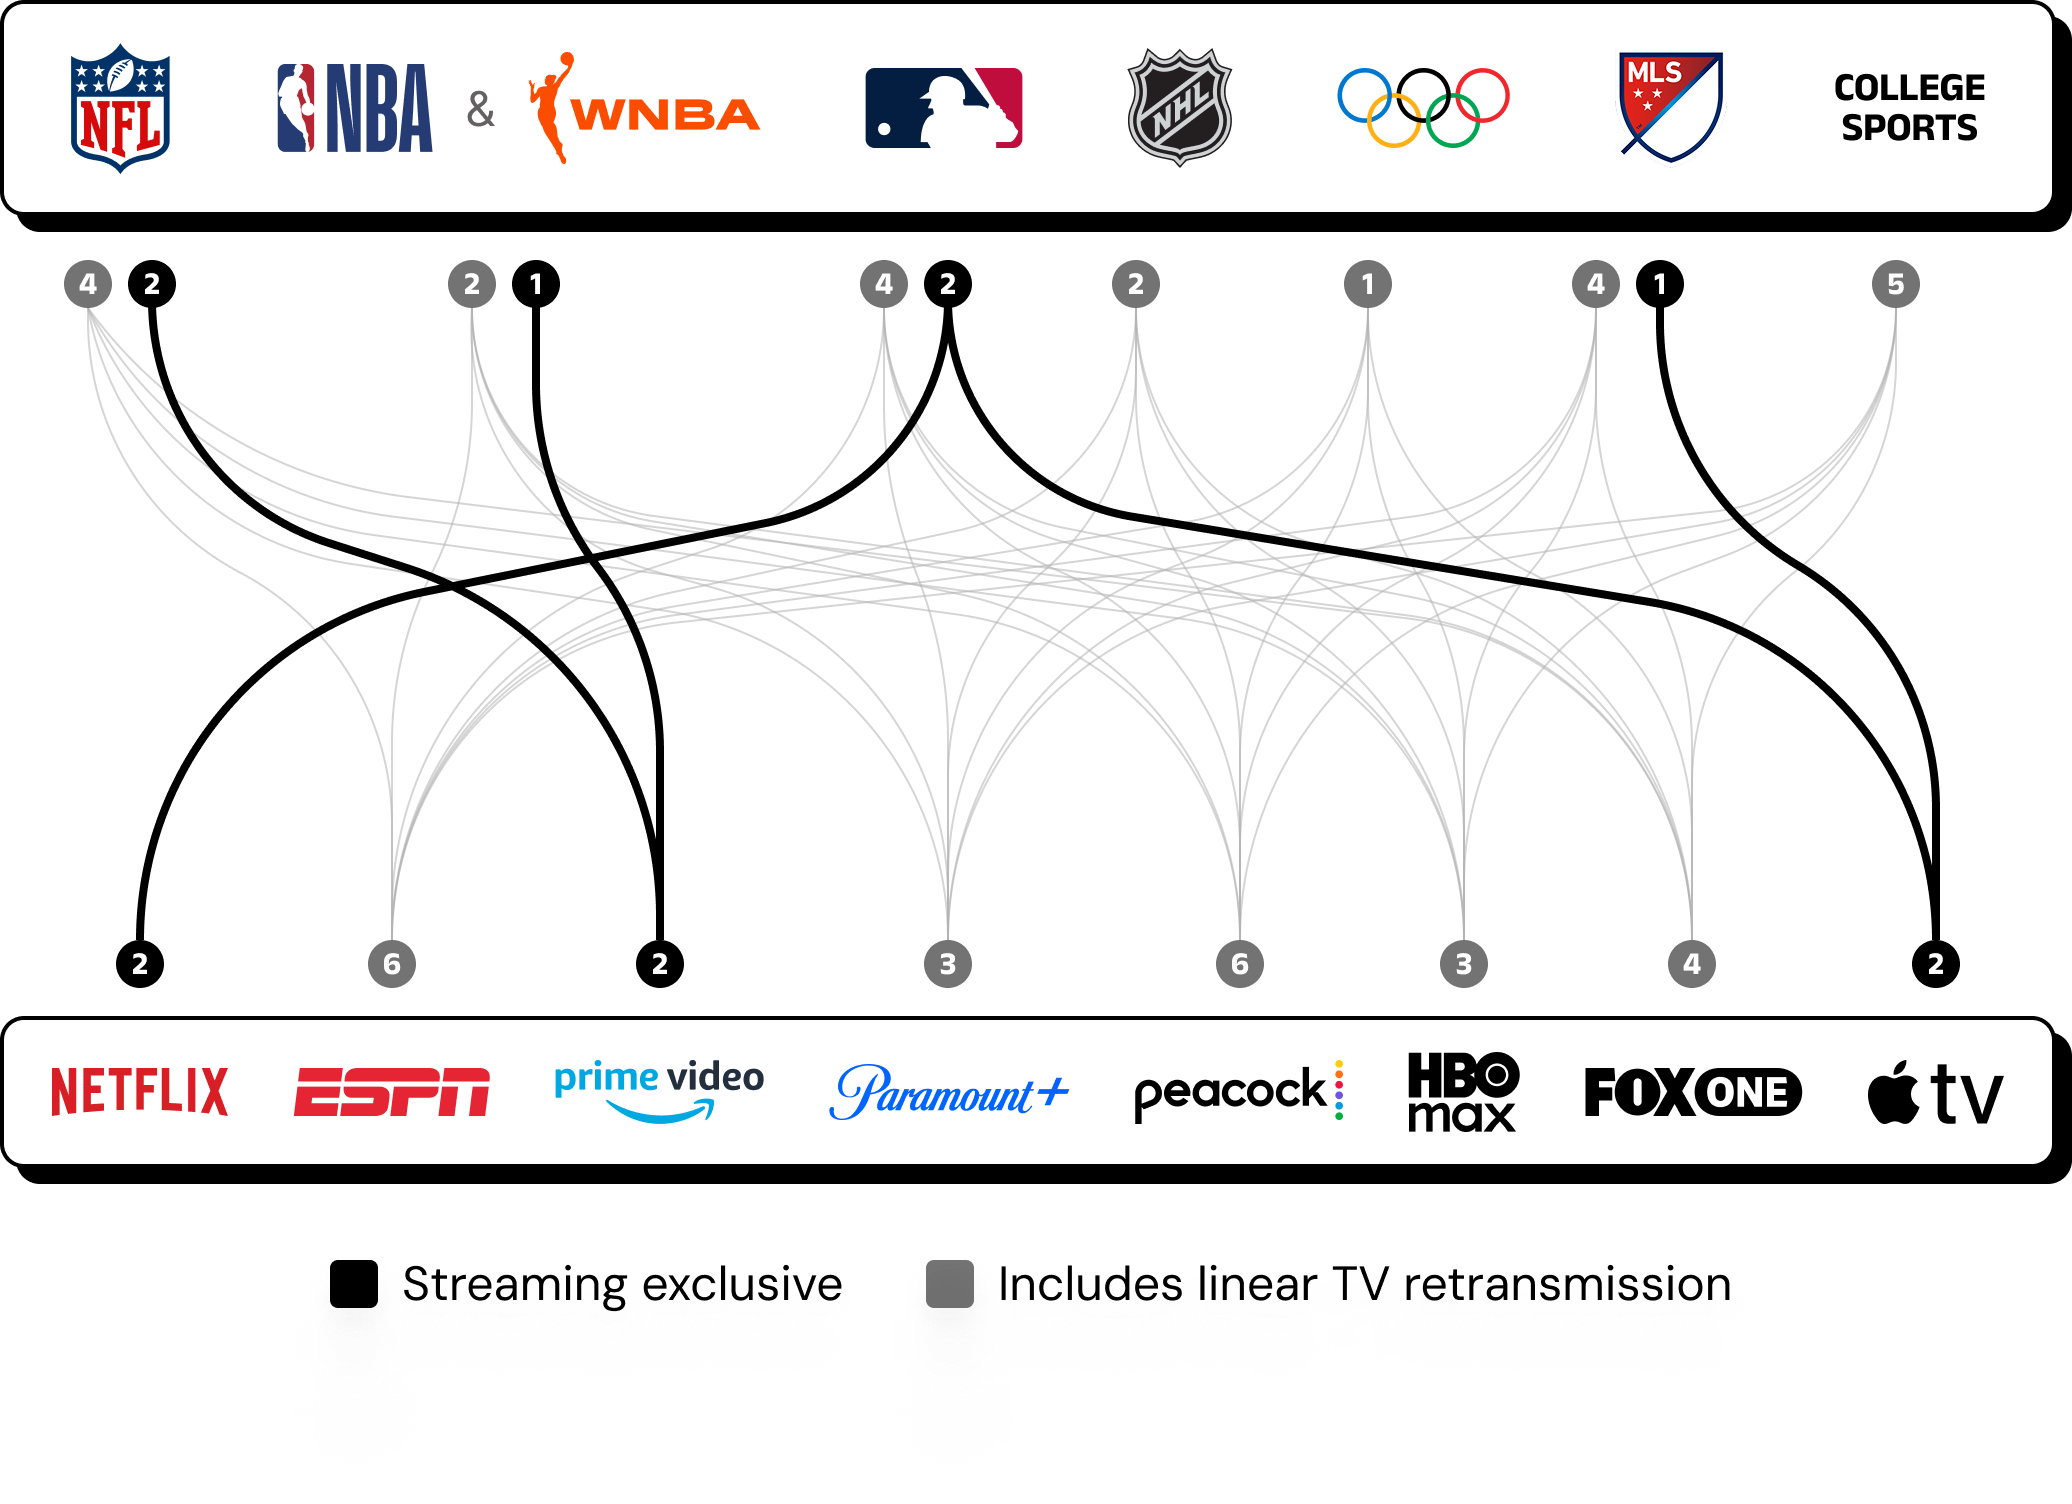
(Images inspired by Jean Carucci | The Streaming Strategy Scholar)

NFL 2026-27: Netflix, YouTube, and More
NFL rights are heading toward $16B a year, a 58% jump. But we learned something in the 2025-26 season that taught the league something new about distribution: Netflix's Christmas doubleheader and new NFL package, YouTube's international slate, and Amazon's Thursday Night deal are pulling viewers at a lower cost per viewer than ESPN or NBC.
Netflix: $3.10
CBS: $3.52
Amazon: $3.84
Fox: $4.19
NBC: $4.95
ESPN/ABC: $8.18
And while we don’t have a YouTube number, it’s safe to say they’d fall somewhere between Netflix and Amazon. This means that Netflix, Amazon, and YouTube can continue to outspend their competition because the math is in their favor. This is a win for the NFL and a win for the streaming apps but it means more paywalls and more apps for your audience.
Netflix: Features a five-game NFL regular-season slate for the 2026 season under a broadcast partnership. The lineup features the international regular-season opener in Australia, a Thanksgiving Eve game, a Christmas Day doubleheader, and a Week 18 finale.
YouTube: The exclusive home of NFL Sunday Ticket for the 2026 season, allowing you to watch out-of-market Sunday afternoon regular-season games on YouTube or YouTube TV.
Prime Video: The home of Thursday Night Football.
Peacock: The home of Sunday Night Football.
CBS / Paramount+: The home of Sunday afternoon games (primarily focusing on the AFC) and select playoff games. You can stream live local CBS games directly on Paramount+ or by using major live TV streaming services.
Paramount+: Streams live local CBS games (requires Premium plan).
Fubo: Includes local CBS.
YouTube TV: Includes local CBS.
Hulu + Live TV: Includes local CBS.
FOX / FS1 / FOX One: The home of Sunday afternoon games (primarily focusing on the NFC) and select playoff games. You can stream live FOX games using the FOX One app, mobile apps, or major live TV streaming services.
FOX One: The streaming app for FOX Sports on connected devices and TVs. You can access live games via a direct subscription or by signing in with a pay-TV provider.
Fubo: Includes local FOX and FS1.
YouTube TV: Includes local FOX and FS1.
Hulu + Live TV: Includes local FOX and FS1.
ESPN / ABC: You can stream Monday Night Football (MNF) on ESPN and ABC using major live TV streaming services, network apps, or standalone digital platforms.
Fubo: Includes ESPN and local ABC.
YouTube TV: Includes ESPN and local ABC.
Hulu + Live TV: Bundles live ABC and ESPN.
Remaining 2026 Sports Calendar
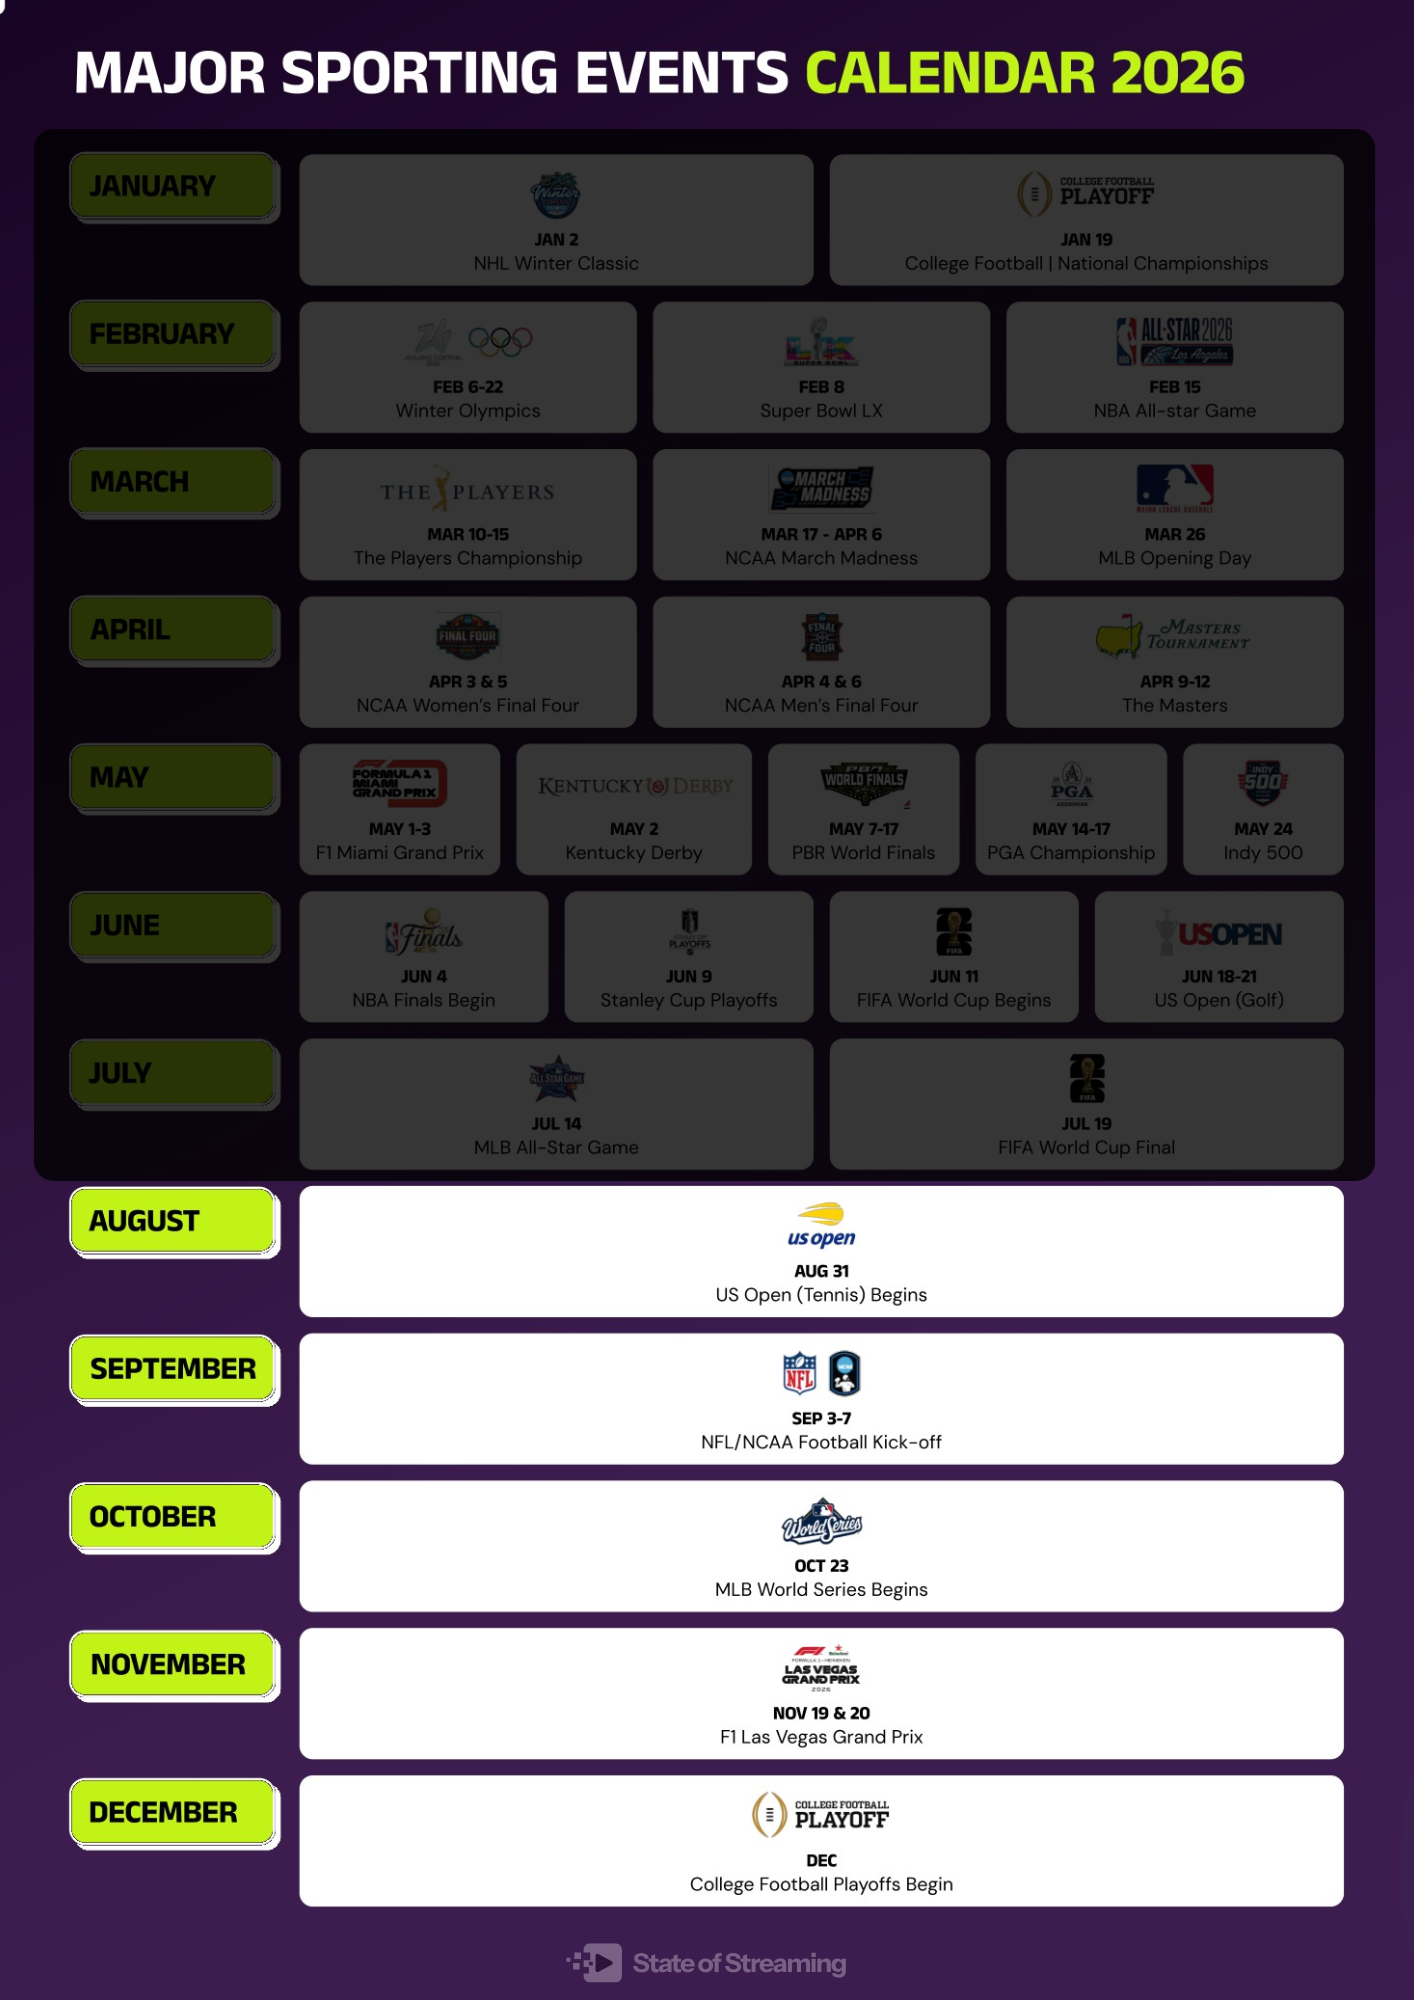

Record Live Sports Viewership: But are you overpaying?
The World Cup Footnote
The 2026 NBA Finals averaged 20.6M viewers on ABC, the largest audience since 1998. The Stanley Cup Final averaged 5.2M viewers which was the largest since 2019. The World Cup Final drew 66.4M across Fox, Peacock, and Telemundo and now stands as the most-watched soccer match of any kind in U.S. television history. English-language coverage on Fox Sports averaged 42.5 million viewers (peaking at 51.7 million), while Spanish-language broadcasts across Telemundo and Peacock pulled in 23.9 million viewers.
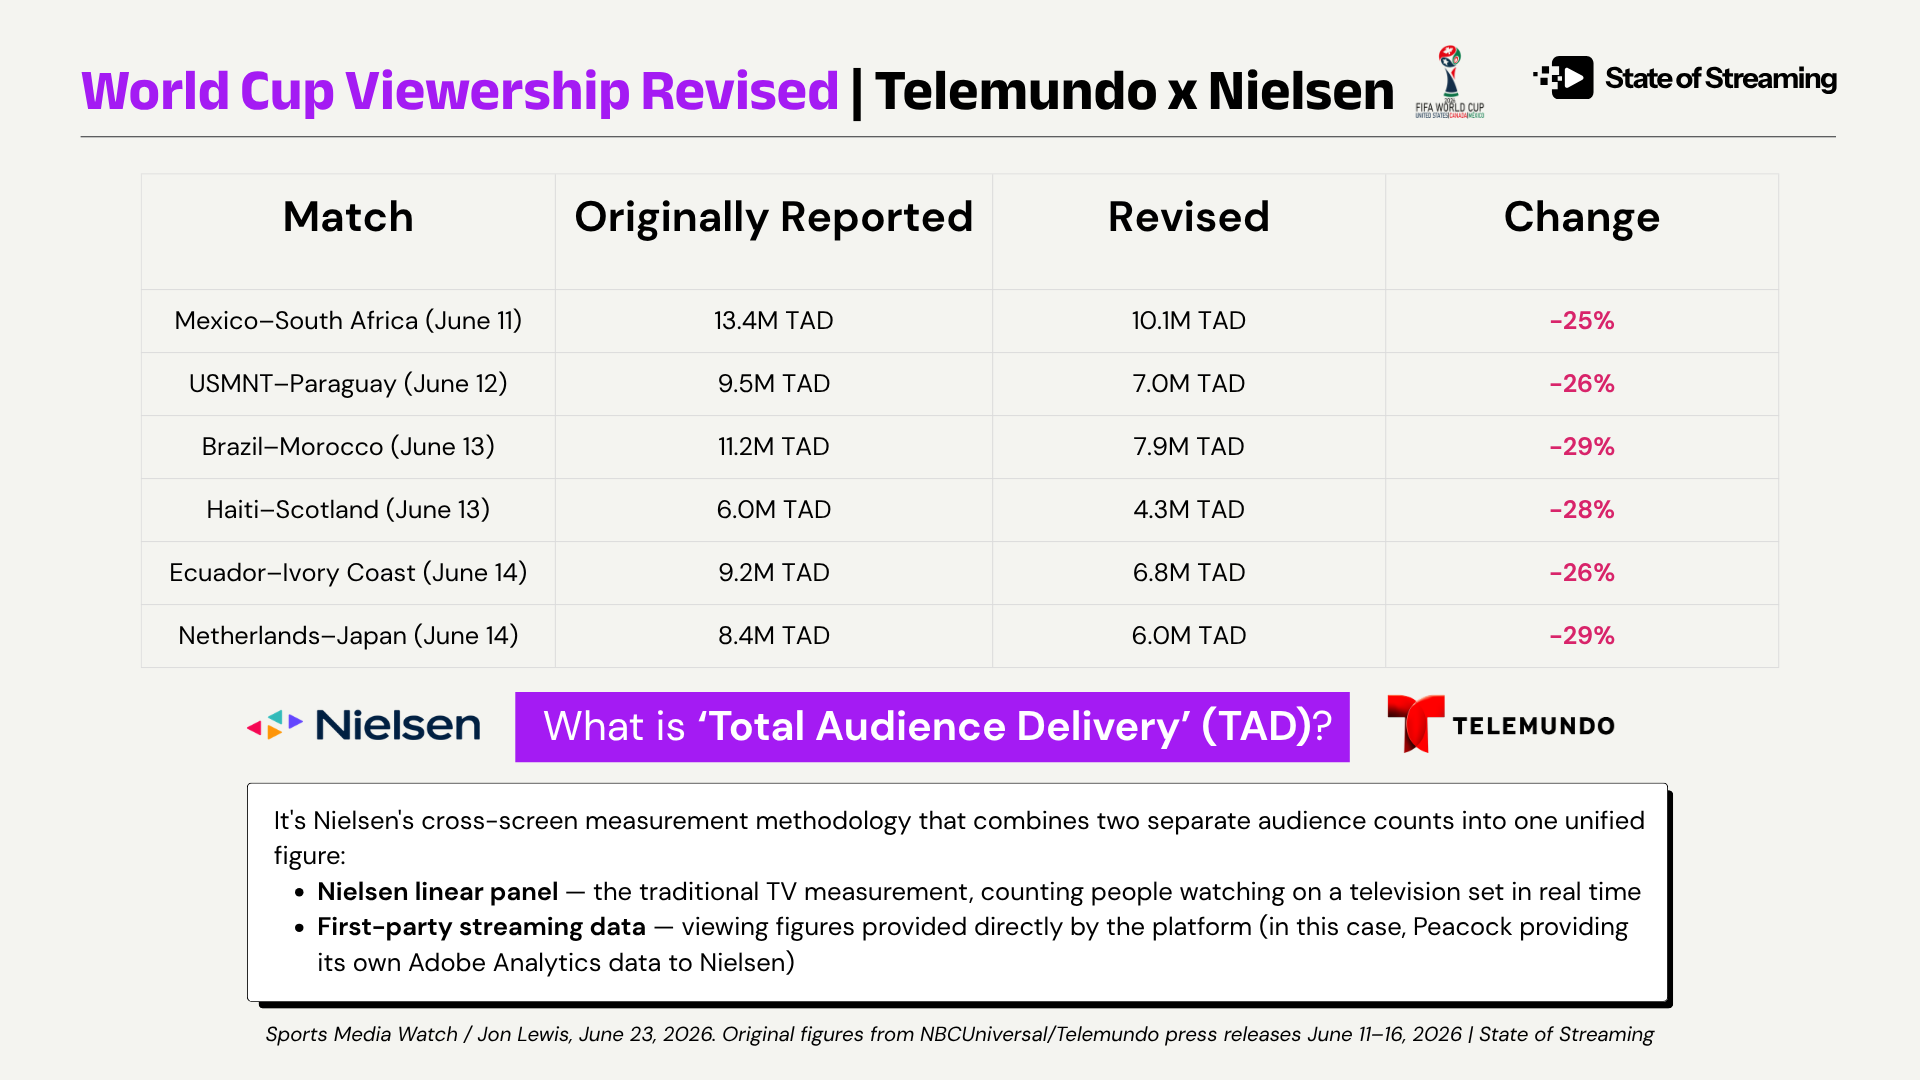
But the best evidence isn't the same as reliable evidence. Let’s look at what happened to Telemundo's viewership numbers mid-tournament. Mexico–South Africa was reported at 13.4M Total Audience Delivery on June 11. By June 23, Nielsen had revised it to 10.1M — a 25% cut. USMNT–Paraguay fell 26%. Brazil–Morocco fell 29%.
Fox Finds The Goal
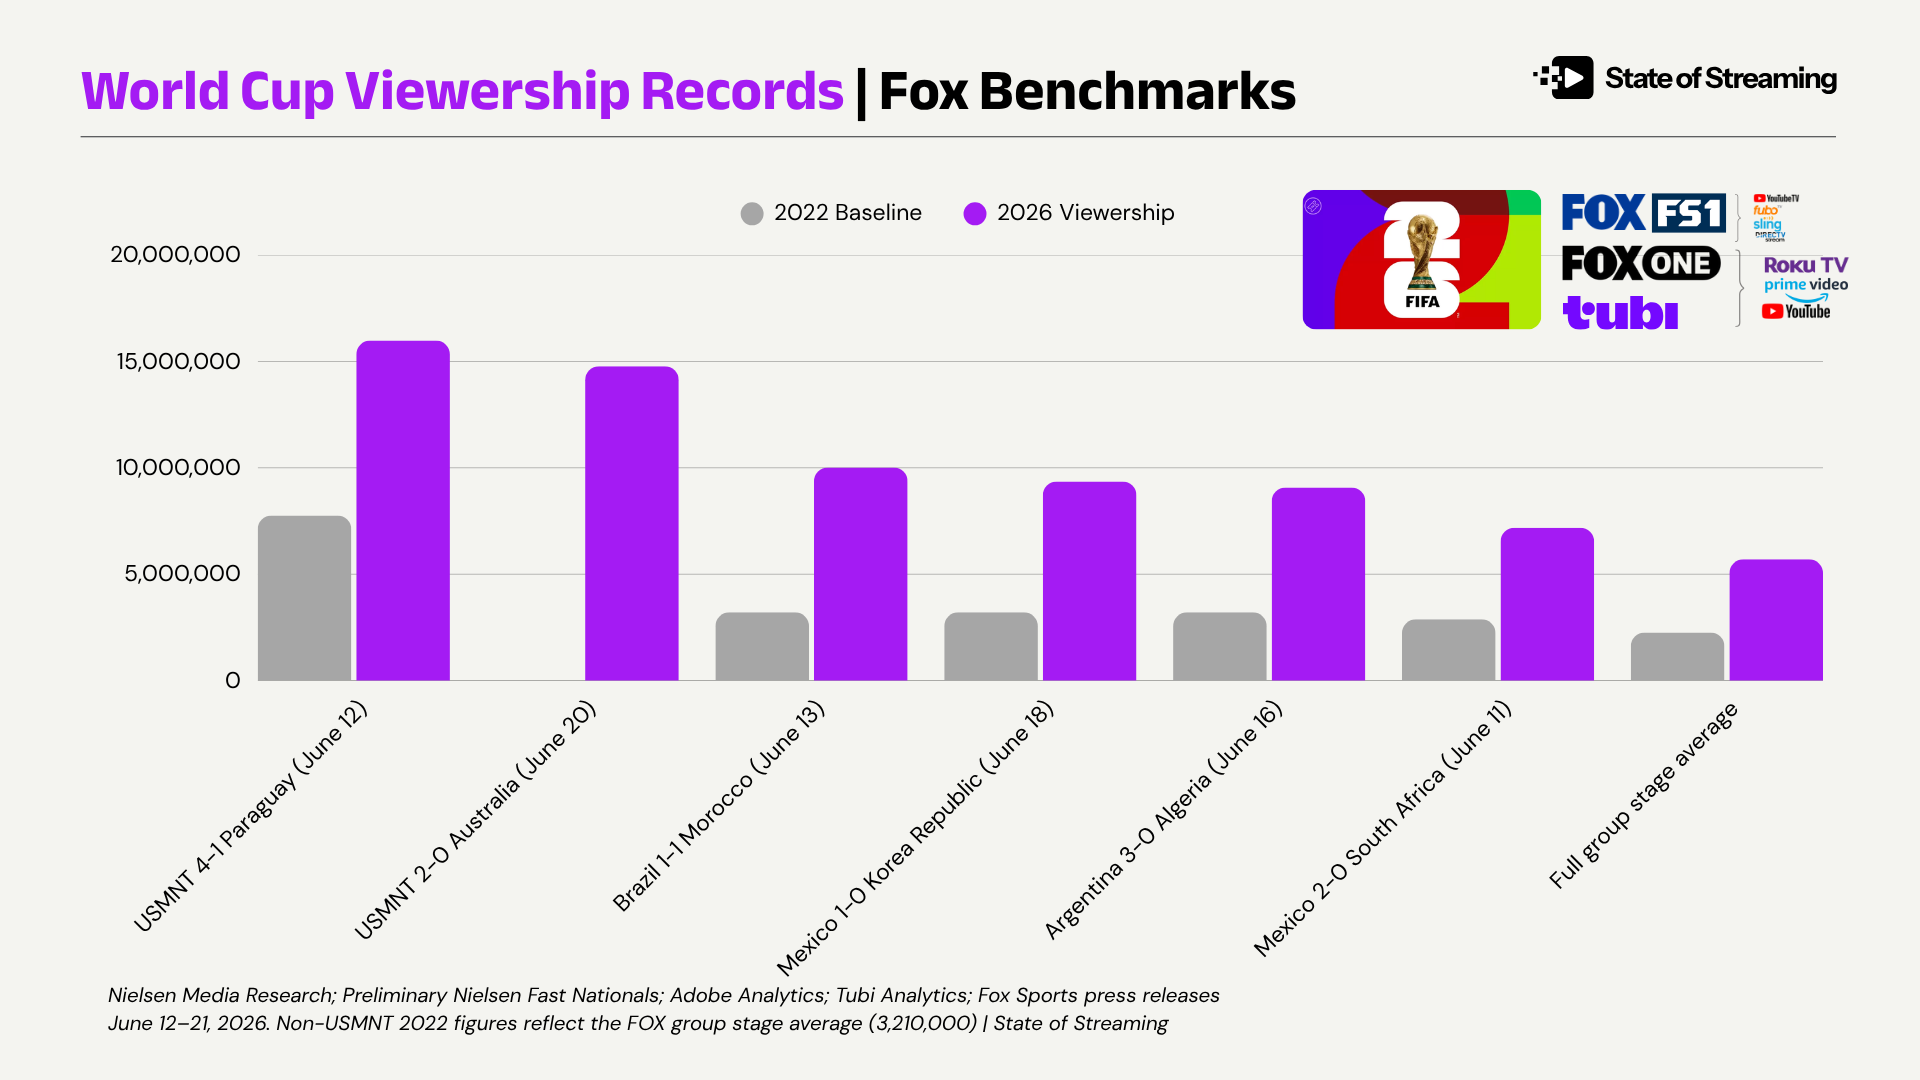
Fox didn't have this problem. Fox Sports utilizes Nielsen's modernized Big Data + Panel methodology combined with digital analytics to provide rapid, stable match-by-match audience reporting that maintains consistency across initial release windows. Fox Sports delivered the most-watched tournament in U.S. soccer history during the 2026 FIFA World Cup, averaging a record-shattering 7.74 million viewers across its 104 matches. Broadcasted across Fox, FS1, and Tubi, this represented a massive 116% increase over the 2022 tournament in Qatar.
Which Inventory Should You Buy (and why)
Ad inventory grew 202% between 2022 and 2026 — from 448 minutes to 1,352 — while spend grew only 152%, which is why the break-even cost per spot actually fell 17%, from $368K to $307K. Part of that inventory growth came from FIFA's mandatory hydration breaks, which added six minutes of dead time per match, up from seven minutes in 2022 to thirteen this year.
The shoulder programming around those same matches performed as well. According to a State of Streaming data partner who manages a nine-figure marketplace for live sports advertising, shoulder programming pulled 10x the viewership and drove a 20x CPM premium. Look for more data related to this ‘Sports Premium’ audience in our September USPI.
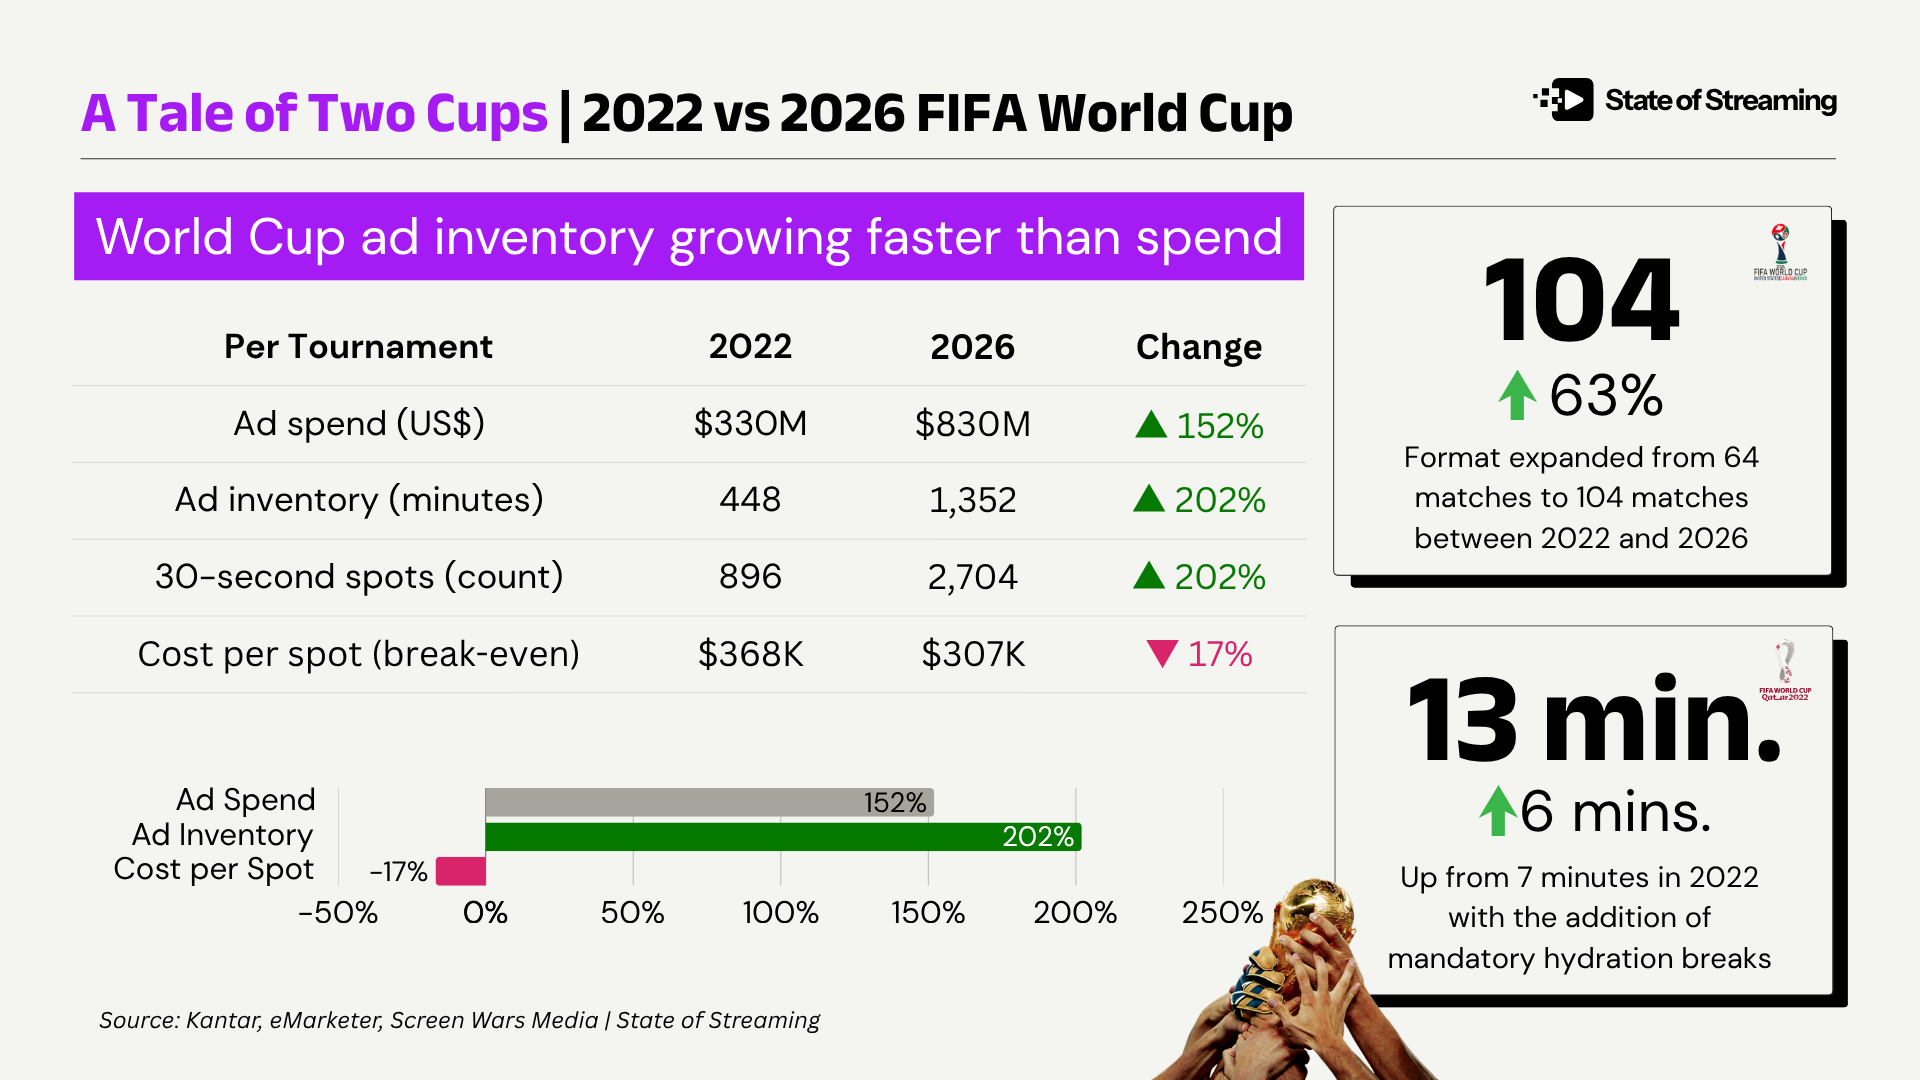
What It Means In a word – options. If you’re a big brand with a big budget, go lock up the space. If you’re looking for more flexibility it means thinking differently about reaching your audience where they are with the math that makes sense for your goals. (Read A Tale of Two Cups analysis here.)

Three M&A Headlines: Signal for the market
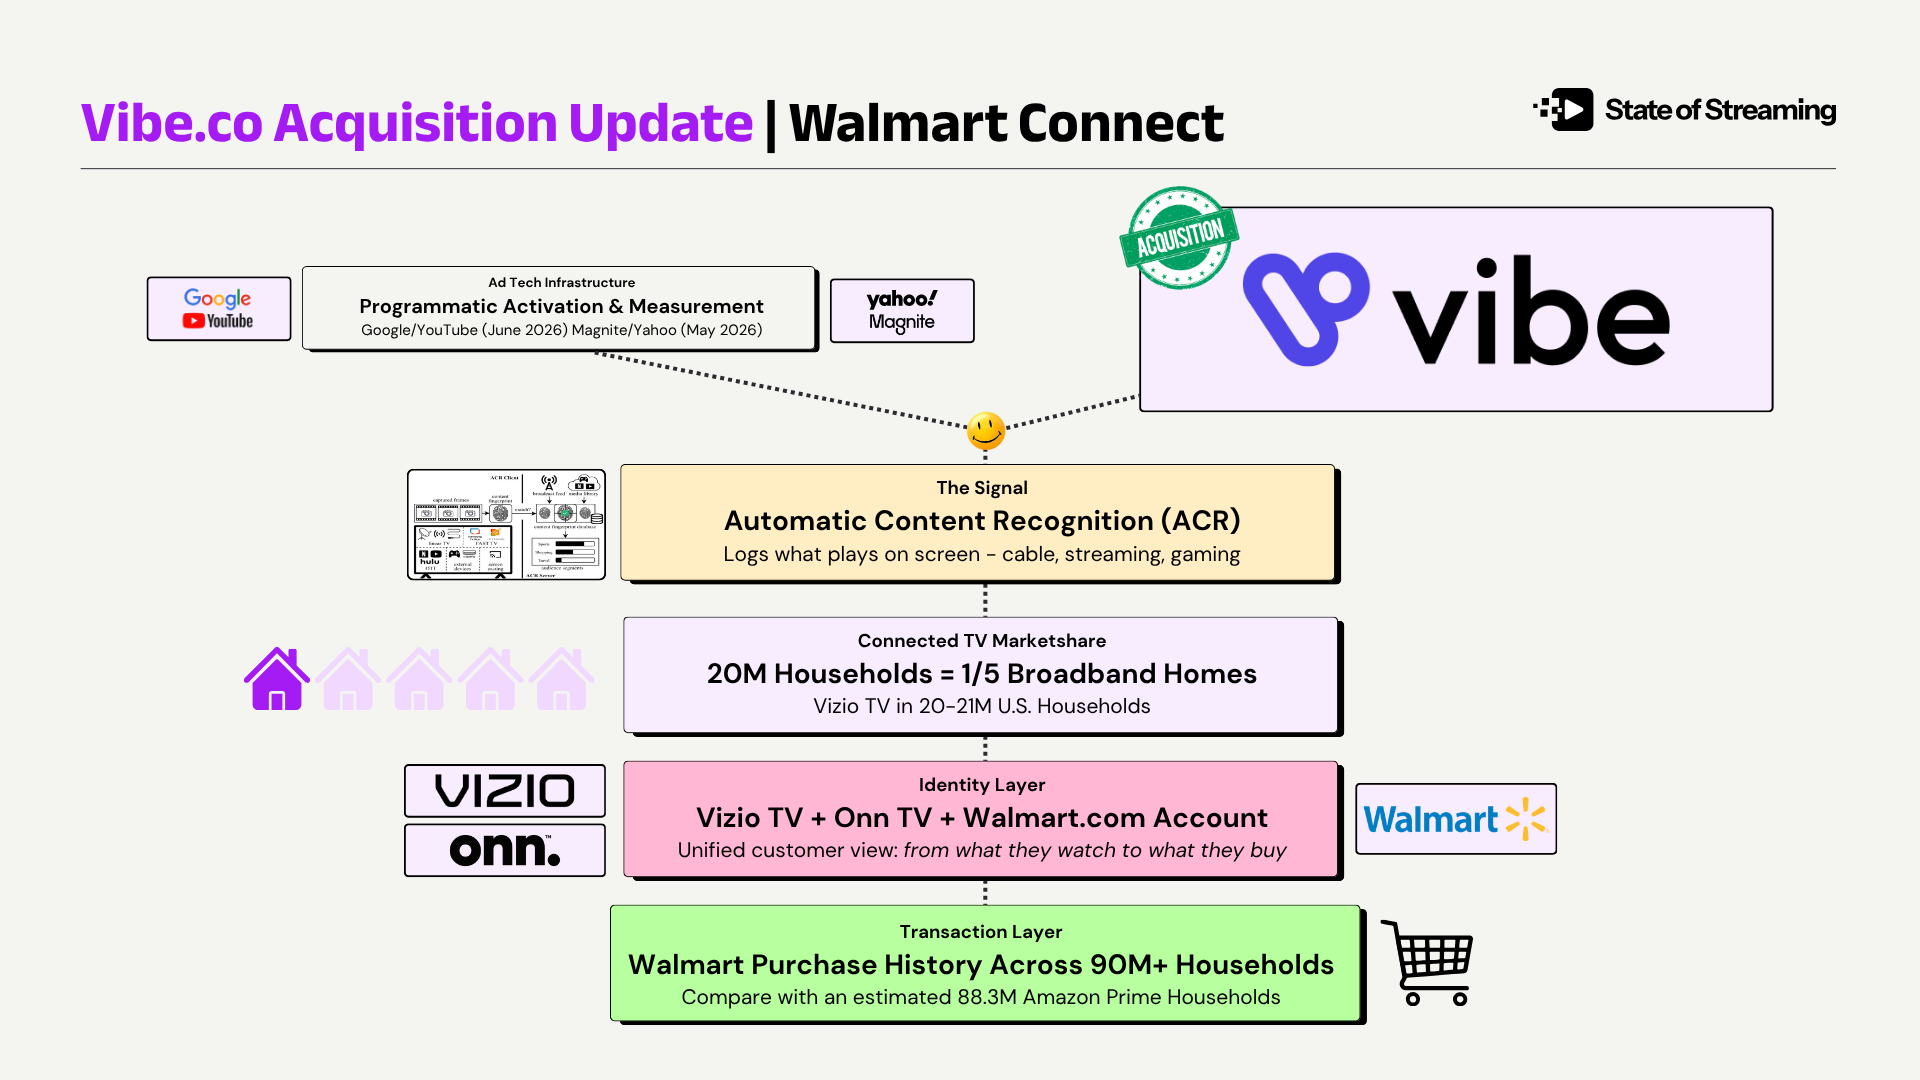
Walmart Acquires Vibe: Owned & Operated Ad Stack
What it means and Why it matters Walmart acquired Vibe.co, a self-serve CTV platform, adding demand from 10,000+ SMB and marketplace advertisers who were not previously participating in programmatically traded media. This undercuts The Trade Desk's independent-buyer thesis and creates distinction between pure content platforms (Netflix, Disney+, Paramount+, Max). It positions Walmart in similar conversation to Amazon’s “connected household” narrative but with self-serve activation, closed-loop purchase data across 90M verified households, and Vizio’s 18.8M monthly active households.
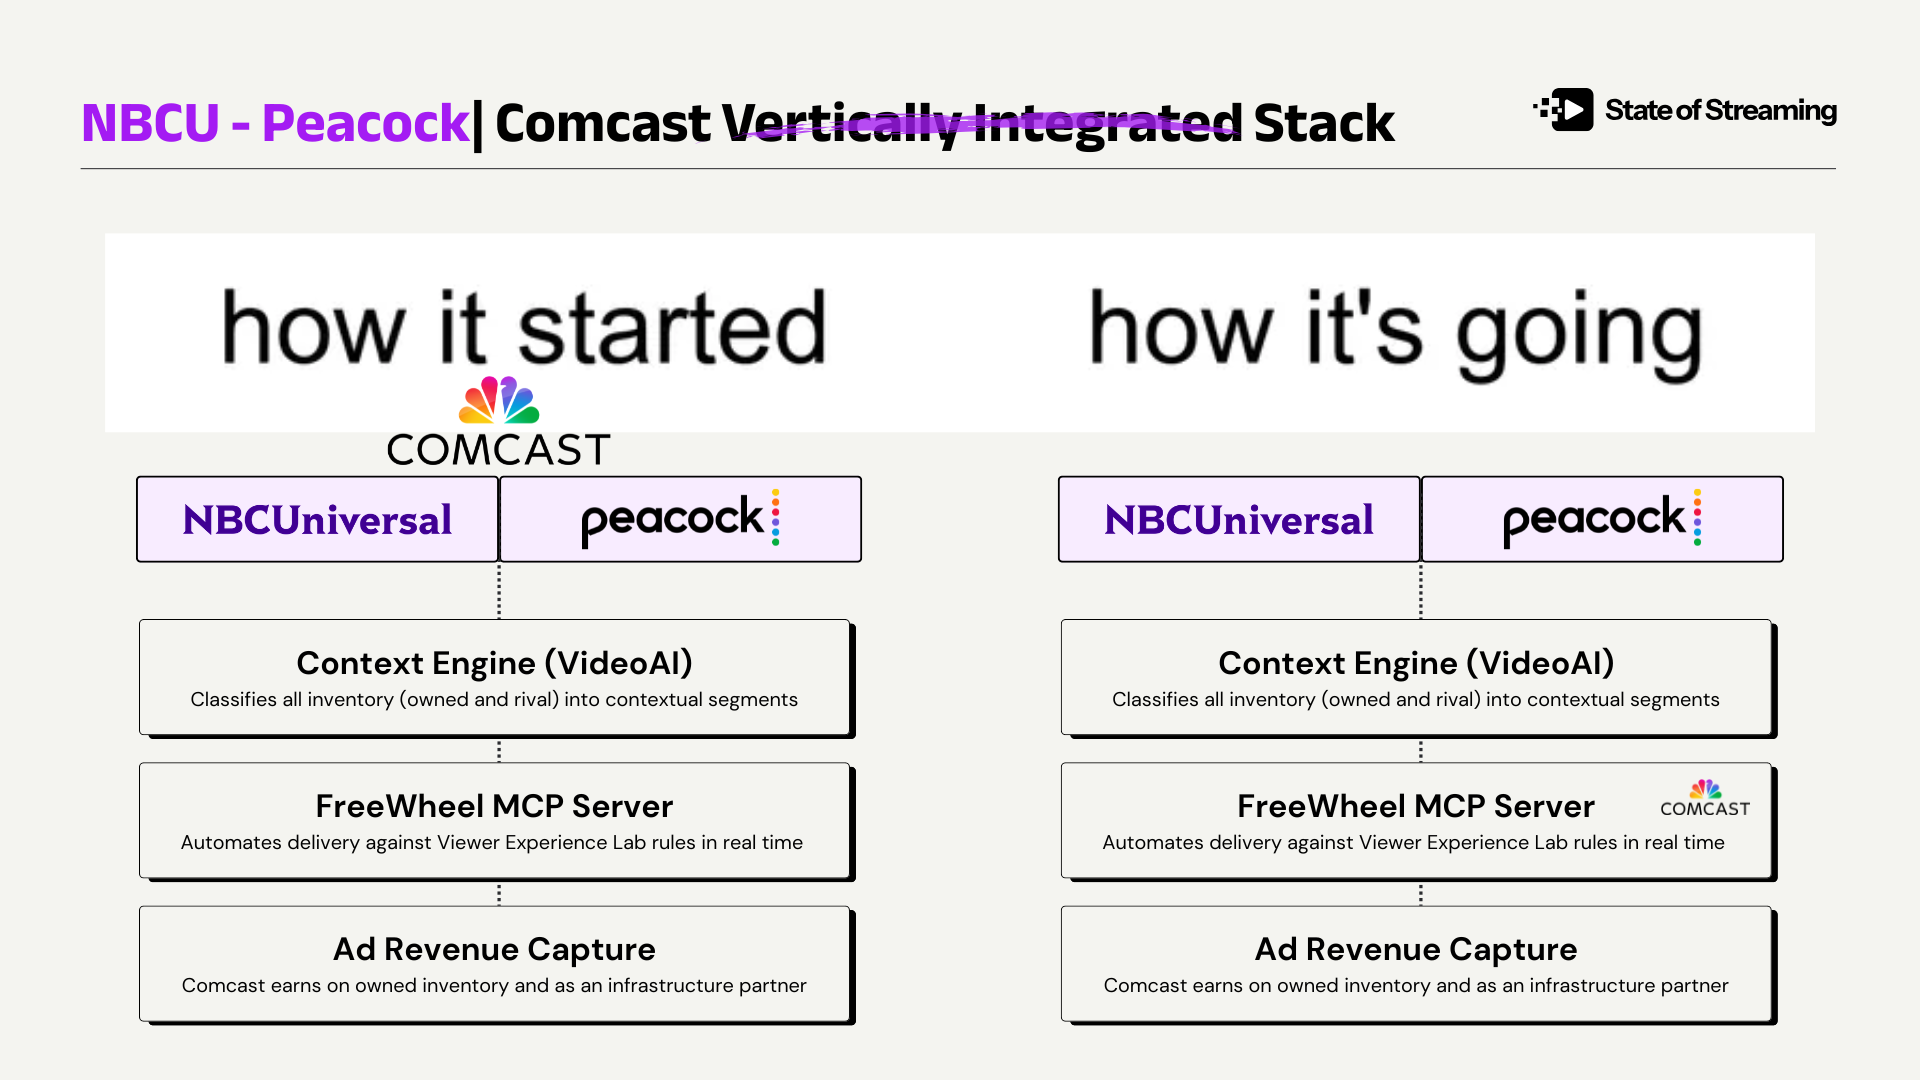
Comcast Spins Off NBCU/Peacock: Strategy is sacrifice
What it means and Why it matters
Comcast spinning NBCUniversal — Peacock, NBC, Telemundo, Bravo, Universal Studios, Sky — into a standalone company by mid-2027 while retaining a 19.9% stake it plans to sell down. Peacock has quietly the most undervalued asset in streaming, with Netflix, Apple, and Amazon each having a unique reason for wanting it — live sports, Telemundo/Sky global scale, or news infrastructure, respectively.
FreeWheel, Peacock's ad decisioning engine, stays with the broadband business, splitting the streaming service from its own programmatic stack. Comcast is betting that vertical integration is dead, has staged Peacock for a bidding-war sale, and likely started the timer for a FreeWheel spinoff of its own.
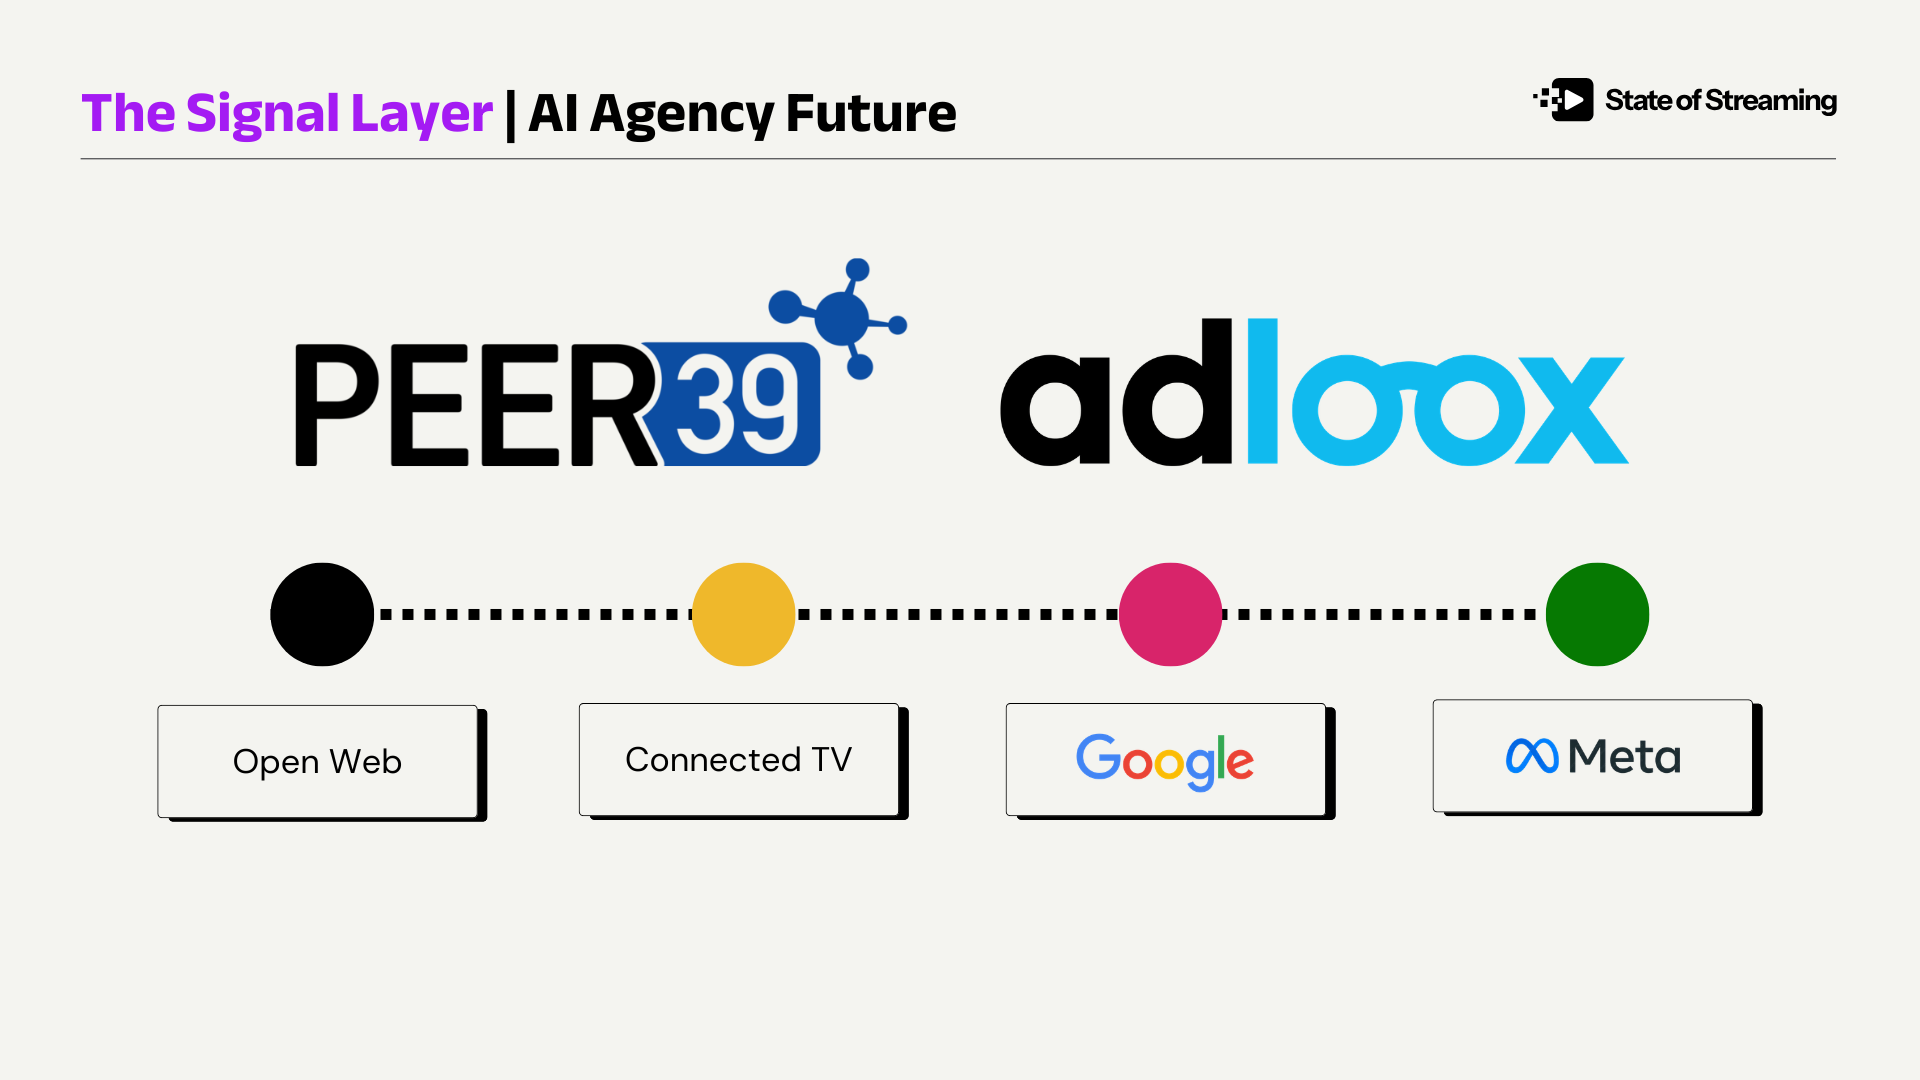
The Signal Layer: Pick your lane
Owned & Operated vs Independent Ad Tech vs Hyperscalers
Peer39 bought Adloox which gives it audited (MRC-accredited) ad verification across Google, Meta, CTV, and the open web in one stack. An agency owning its own ad tech shifts where the leverage sits in the transaction — from renting infrastructure to controlling the ground truth.
In the same quarter, The Trade Desk launched a unified partner login (OpenTTD) on the same day while FirstPartyCapital started taking equity stakes to help brands build their own ad tech instead of renting someone else's.
Meanwhile Amazon and Google skip both fights entirely. Ad tech is quickly splitting into owned-and-operated vs. everyone-else, and as agentic takes over buying, whoever validates the data an agent trusts owns the deal.
Get the SOS. Brief
The sharpest streaming intelligence, delivered to your inbox.